SAS/IML software is often used for sampling and simulation studies. For simulating data from univariate distributions, the RANDSEED and RANDGEN subroutines suffice to sample from a wide range of distributions. (I use the terms "sampling from a distribution" and "simulating data from a distribution" interchangeably.)
For multivariate simulations, the IMLMLIB library contains a series of modules for sampling from multivariate distributions.
Included in this module library is the RANDNORMAL module which enables you to sample from a multivariate normal distribution with a given mean and covariance structure. You need to specify three parameters:
- N: the number of observations that you want to sample
- Mean: the mean of the distribution (This is the "population mean.")
- Cov: the covariance structure of the distribution. (This is the "population covariance.") The covariance structure is specified by using a matrix whose (i, j)th element specifies the covariance between the ith and jth variables. If you want to sample from variables that are uncorrelated, use a diagonal covariance matrix. To sample from identical uncorrelated variables, use an identity matrix.
Sample from the Multivariate Normal Distribution
The following statements generate 1,000 random observations from a multivariate normal distribution with a specified mean and covariance structure. The first five observations are displayed.
proc iml;
/** specify the mean and covariance of the population **/
Mean = {1, 2, 3};
Cov = {3 2 1,
       2 4 0,
       1 0 5};

NumSamples = 1000;
call randseed(4321);  /** set seed for the RandNormal module **/
X = RandNormal(NumSamples, Mean, Cov);
print (X[1:5,])[label="First 5 Obs: MV Normal"]; |
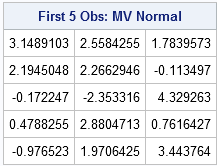
How can you verify that the computation is correct? That's an interesting question and a complete answer will have to wait for a future post. However, you can convince yourself that the observations probably came from the specified distribution by computing the sample mean and the sample covariance matrix. These sample statistics should be close to the parameters of the population
Computing the Mean of the Sample
The following statements compute the mean vector of the sample:
/** check the sample mean **/ SampleMean = X[:, ]; print SampleMean; |
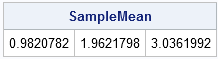
The sample mean is, indeed, close to the mean of the population. You should expect the sample mean to approach the population mean as the number of samples gets large. (Recall that, in the univariate case, the sample mean is distributed as σ2/N, where σ2 is the population variance. The same idea holds for the multivariate mean vector.)
Computing the Covariance of the Sample
You can compute the sample covariance matrix by using the following statements:
/** check the sample covariance **/ C = X - SampleMean; SampleCov = C` * C / (NumSamples-1); print SampleCov; |
For readers who have upgraded to SAS/IML 9.22, the following statement is an alternative way to compute the covariance matrix:
/** SAS/IML 9.22 and beyond: call the COV function **/ SampleCov2 = cov(X); |
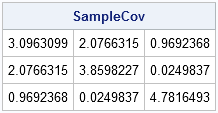
The sample covariance matrix is also close to the covariance parameters for the population. The sample covariance matrix should approach the population covariance as the number of samples gets large. (The distribution of the sample covariance matrix is called the Wishart distribution.)
Sampling When You Have a Correlation Matrix
A correlation matrix is just a covariance matrix for data that have been standardized. Consequently, it is acceptable to use a correlation matrix as the third argument to the RANDNORMAL function. Suppose that S is a covariance matrix and R is the corresponding correlation matrix. If you use R as the third argument to the RANDNORMAL function, the resulting sample will have the same general shape as if you had used S, but the shape will be linearly scaled in certain directions.
If you have correlation matrix instead of covariance, and you also have a set of variances, you can transform the correlation matrix into a covariance matrix.

22 Comments
Pingback: How to sample from independent normal distributions - The DO Loop
Pingback: Readers’ choice 2011: The DO Loop’s 10 most popular posts - The DO Loop
Pingback: Testing data for multivariate normality - The DO Loop
Pingback: Generating a random orthogonal matrix - The DO Loop
How could I sampling from the bivariate exponetial distribution and bivariate weibull distribution?
That's a difficult question, and there are several parameterizations for those distributions. I recommend the book by Mark Johnson (1987) Multivariate Statistical Simulation. In it, he shows how to simulate from the Morganstern distribution with correlated exponential marginals. Unfortunately, it only models weakly correlated variables. For the bivariate Weibull, start with X1 and X2 that are bivarate exponential. Then define Y1 = X1^{1/alpha) and Y2 = X2^{1/alpha). Y1 and Y2 are bivaraite Weibull and correlated, although I'm not sure how to express the correlation analytically in terms of the corr(X1,X2).
Pingback: Computing the nearest correlation matrix - The DO Loop
What is the most efficient way to create multiple data sets (in longitudinal format) from the multivariate normal distribution? This is especially useful for running simulations.
Let's say you want to simulate k MVN samples, where each sample contains N observations. You want an ID variable with values 1-k that identifies each sample, and variables x1-x_p that contain the MVN data.
X = RandNormal(N*k, mu, Cov); /* draw k samples of size N */ ID = shape( repeat(T(1:k), 1, N), N*k ); varNames = "ID" || ("x1":("x"+strip(char(ncol(Cov))))); Y = ID || X; create MVN from Y[colname=varNames]; append from Y; close MVN;Pingback: How to generate multiple samples from the multivariate normal distribution in SAS - The DO Loop
I need to generate multivariate random samples from a probability distribution to use in a SAS Training Course but we do not have access to PROC IML.
We use either SAS Enterprise Guide 5.1 or SAS Enterprise Miner 12.1 for Statistical Data Analysis.
While I fully appreciate the functionality of IML and the advantages of using a Matrix Approach, I would like to know if it is possible to create the above samples in SAS Enterprise Miner.
Alternatively is there a magic macro using BASE SAS that emulates matrix methodology?
You can use the SIMNORMAL procedure in SAS/STAT software, as described on p. 136 of my book Simulating Data with SAS.
Pingback: The Wishart distribution: Covariance matrices for multivariate normal data - The DO Loop
If I have many variables how I can test these variables that their distributions are multivariate normal.
Read the article "Testing data for multivariate normality."
Pingback: Models and simulation for 2x2 contingency tables - The DO Loop
greetings sir rick! i am a BS in Statistics student in Central Luzon State University, Philippines, i am currently working on my thesis. my problem is how to simulate multiple predictors (p=25) that are correlated and as well as they are multivariate normally distributed.
does SAS/IML or SAS/STAT have procedure options for my problem sir. thanks in advance to your response sir
Yes, and the function is described in this article. You can use a Toeplitz matrix to construct a 25x25 covariance matrix.
Pingback: Simulate multivariate clusters in SAS - The DO Loop
How could I sample from a truncated multivariate normal distribution?
You can use the accept-reject technique to sample from a truncated distribution from any family.