Football fans around the world have something exciting to look forward to, with the European Championship scheduled to take place in June and July 2020. Twenty teams out of 24 have already qualified for the tournament, and after last Saturday's draw, the teams and fans are now getting ready to make their travel plans for next summer.

Multiple venues
Since next year’s tournament is an anniversary edition, it will be played in venues all across Europe. This is very different from previous events, which have generally taken place in a single host country.
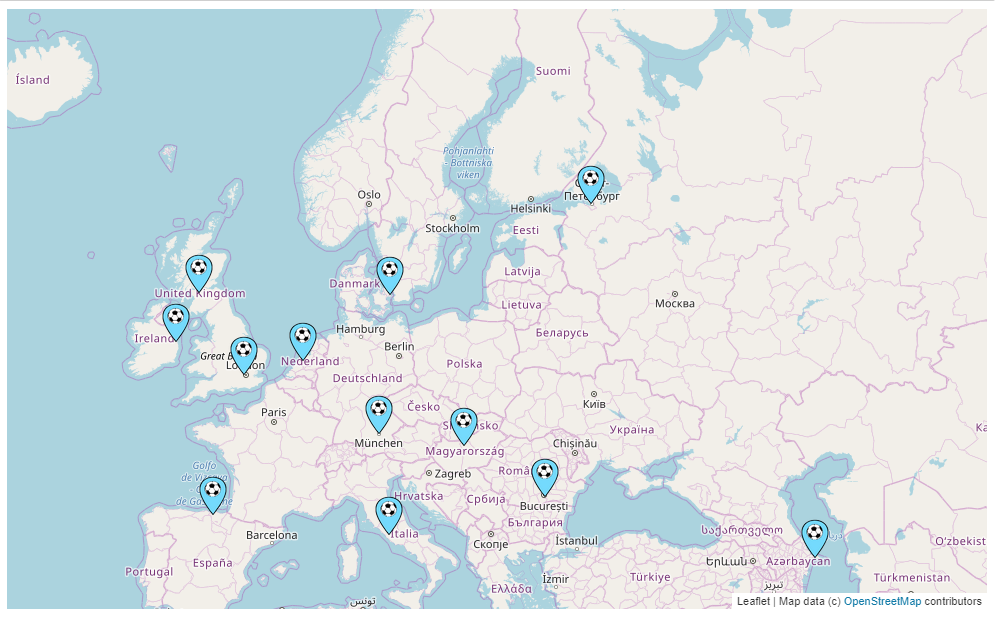
This could pose a real challenge for fans. They may have to travel significant distances to watch more than one or two games. The 12 venues are spread across Europe, from Baku in the east to Dublin in the west, and St. Petersburg in the north to Rome in the south.
Perhaps unsurprisingly, reports suggest that 82% of supporters were not happy about the games being played so far apart. The organisers are trying to help, with easier access to visas and cheaper tickets. However, those looking to get to a number of matches need to do some serious thinking about their travel plans.
We decided to help them find the best possible travel options by using SAS Optimization through Python. We've not just investigated the fastest and cheapest routes, but also the most eco-friendly ones.
Analysis scenario
For this optimised scheme we had a general fan in mind: someone who just wants to watch football rather than someone who follows a national team. We also assumed that fans would want to make the most of the opportunity and visit as many cities as possible! Maybe not all fans will want to visit all the venues, of course. We’re taking this extreme scenario as an interesting case for analysis. For fans planning to visit fewer venues, stay tuned. We will look at making a handy tool available later on.
During the tournament, 51 games will be played in 12 cities (in 12 different countries). The distances between city pairs add up to over 110,000 kilometres, so it certainly is not going to be possible to find the optimal route without help! But SAS Optimization through Python can make it happen.
Travel options
The first option looked at finding the fastest travel schedule to see a match in every single stadium.
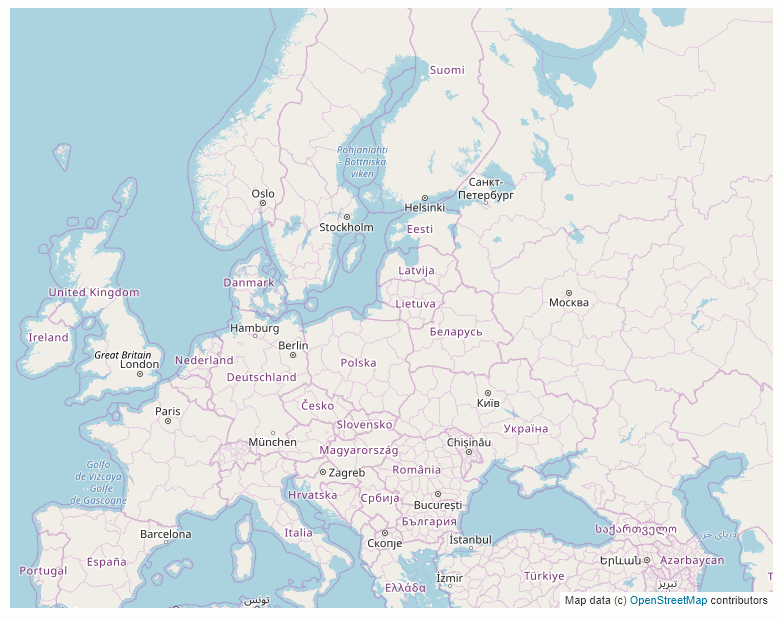
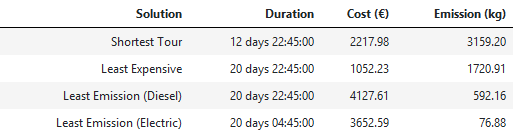
The fastest trip starts in Munich and ends in Copenhagen. It can be completed in just 12 days and 23 hours, assuming a buffer time of two hours around games (one before and one after). This was designed to allow for travel to and from the stadium. Unsurprisingly, this schedule includes only flights. The map below visualizes the different legs of this trip. More details about it can be found in the gallery.
The second option was to find the schedule to see a match in every stadium at the lowest possible travel cost.
We did not consider accommodations or match ticket costs in this analysis – only the costs of the different modes of transportation. Data was provided by Rome2Rio.com, for which we’re very thankful. The costs used in our analysis are as advertised on 26 November 2019.
This new schedule brings the cost of the trip down from €2,217 to €1,052. But the trade-off is that the schedule will go from 13 days in the fastest scheme to 21 days in this one. This is mainly due to the different forms of transportation used: fewer flights and more bus routes. For this cheapest schedule, you would start in St. Petersburg and end in Baku. All details can be found again in the gallery.
Cost to the environment
There is no question that moving between 12 cities across 12 countries will have considerably more environmental impact than moving between just a few cities in one country. The potential for heavy carbon dioxide or equivalent gas (CO2e) emissions has already been heavily criticised. The organisers have announced that they are planting 600,000 trees to offset the potential impact. A noble idea, but probably insufficient, as recent reports question the effect of tree-planting initiatives (plus, where to plant all those trees?).

Therefore, we wanted to include total CO2e emissions in our optimisation model and used the "greenhouse gas reporting" from the UK government to provide figures. We assumed CO2e emissions to be 180.78 g/km per passenger for flights,112.86 g/km per passenger for ferry travel, 27.79 g/km per passenger for bus travel, 170.61 g/km per passenger for driving alone or 85.3 g/km per passenger for two people driving together (medium-size diesel car) and 5.96 g/km per passenger by train.
By integrating these CO2e emissions in our optimisation model and changing the objective, we can find the best schedule to see a match in every stadium but minimise total CO2e emissions.
This most eco-friendly scenario would take you again from St. Petersburg at the start of the trip to Baku at the end of it. But this time the travel plan includes only two flights! All other journeys are by train. The total emissions are just 592 kg, compared to 3,159 kg (fastest trip) and 1,720 kg (cheapest trip).
We could reduce this still further by replacing our diesel car with an electric version. Ignoring the charging challenge for a minute, this could help us reduce total emissions to just 76 kg! All details for this trip can once more be found in the gallery.
Fastest, cheapest or greenest?
Here is the comparison of all the solutions we covered:
Of course, in practice fans will have additional things to consider, like availability and cost of accommodations, airline preferences, the need to obtain visas, and which matches they actually want to watch! However, transportation will be a general concern during the event. And with the analysis provided here – using the capabilities of SAS Optimization through Python – we can help many fans with their travel decisions.
Learn more
Are you a data scientist who would like to find out more about using SAS and open source together? Check our website or find our packages on GitHub. Many customers around the world today are already using SAS for optimisation, not just for travel plans but also to improve the efficiency of production lines, for example.
From us here at SAS: Good luck to all the fans and teams. And enjoy the journey!
Data sources and credits:
- Rome2rio helps you discover how to get anywhere by plane, train, bus, ferry and car.
- OpenStreetMap is a map of the world, created by people like you and free to use under an open license.
- The traveling baseball fan problem and Visiting all 30 Major League Baseball Stadiums offered inspiration for this project.

1 Comment
Good stuff!