Tag: Cluster Groups

Data Visualization
Sanjay Matange 0
Naomi's Graph Makeover Contest

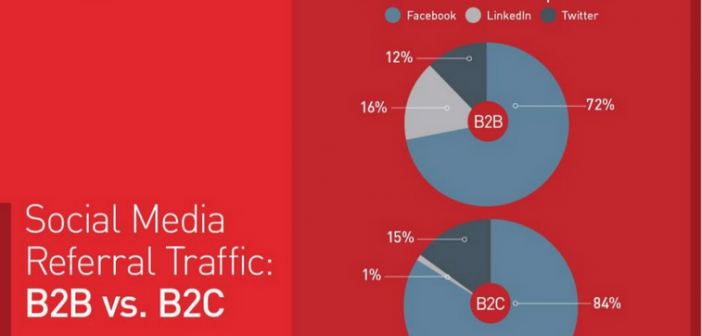
Naomi Robbins has posted a contest, part 1 of which is to submit alternative representations for the following graph: Clearly, usage of two pie charts to represent the share of the B2B and B2C referrals will invite many responses.  To create the graph, I took the data shown in the Pie Charts themselves, so we are using percent

Data Visualization
Sanjay Matange 3
Butterfly plots

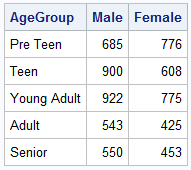
When comparing results by category and group,  putting the items to be compared close together usually leads to a graph that is easier to decode.  Take the case of the data (simulated) shown below. Here we have population by age group and sex.  To compare the population by sex, it is

Data Visualization
Sanjay Matange 0
Cluster groups

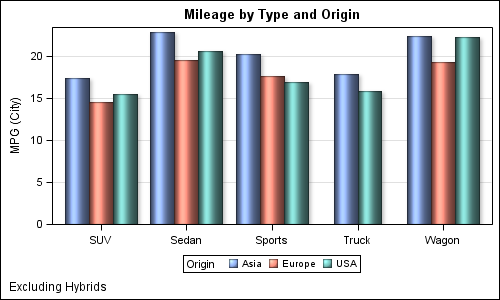
The topic of cluster groups comes up often.  By cluster group I am referring to the feature in bar charts where the group values are displayed side by side. With SAS 9.3, SG Procedures support stack or cluster grouping for Bar Charts and overlay or cluster grouping for all other