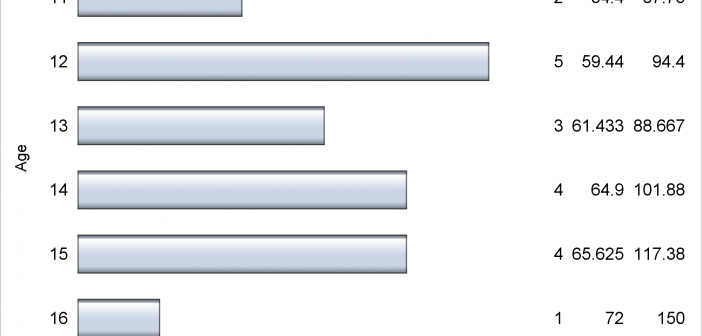
Axis tables can use the SUM= option to summarize data and display means, medians, sums, and percentages. They can instead be used to display data, text, and statistics without any summarization.

Axis tables can use the SUM= option to summarize data and display means, medians, sums, and percentages. They can instead be used to display data, text, and statistics without any summarization.
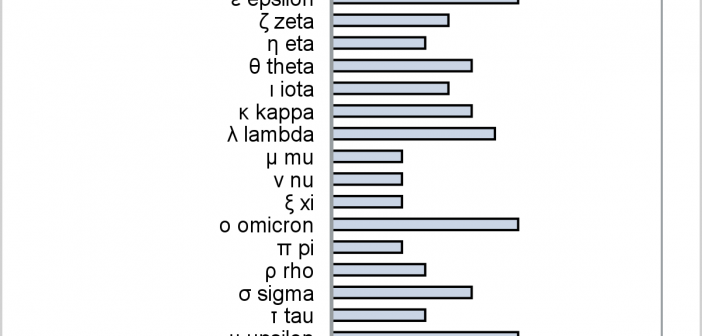
This post provides a general macro that enables you to easily display special characters (Unicode) in axis table columns.
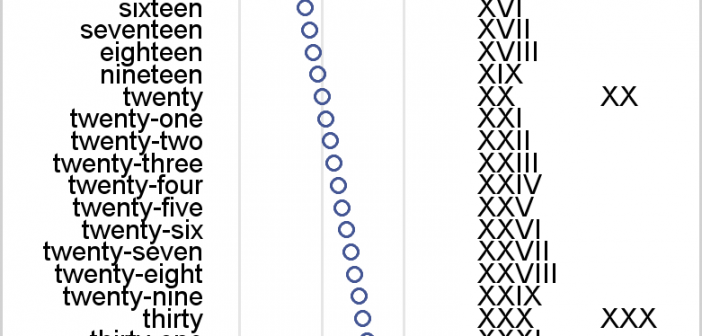
I review some fundamental principles of creating axis tables along with graphs that have TYPE=LINEAR or TYPE=DISCRETE axes.
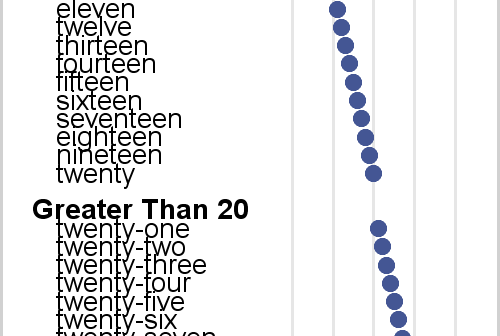
Axis tables enable you to combine tabular and graphical information into a single display. I love axis tables. My involvement with axis tables dates back over 30 years to their ancient predecessor, the table that contains an ASCII bar chart. In the mid 1980s, I created a table in PROC
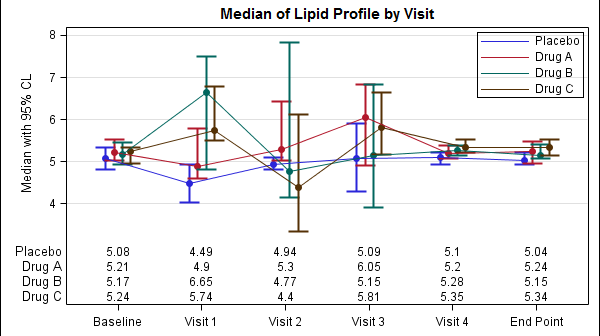
The display of statistics, aligned with graphical plot of the data, is a common requirement for graphs, especially in the Clinical Research domain. In the previous post on Discrete Offset, I used an example of the Lipid Profile graph. Now, let us use the same example and add the display of statistics in
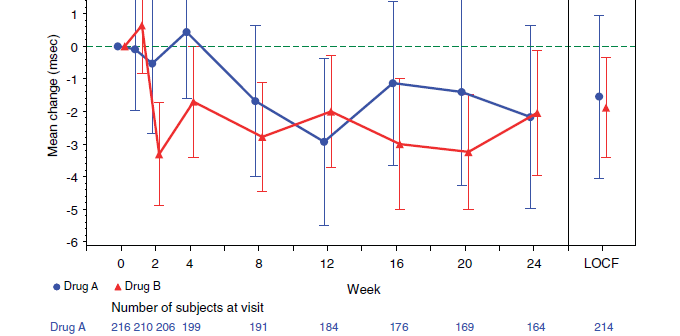
A key element of graphs used for analysis of safety data for clinical research is the inclusion of statistical data (or tables) about the study that are aligned with the x axis of the graph. A common example of this comes from the paper "Graphical Approaches to the Analysis of
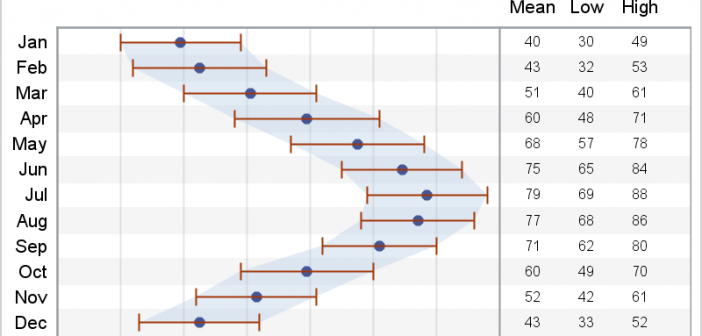
In a previous article we discussed how to add axis aligned statistics table to a Lipid graph using GTL. Other graphs such as the Survival Plot also utilize the same technique to display the "at risk" statistics aligned by time or visits along the X axis. Often, we also need to display
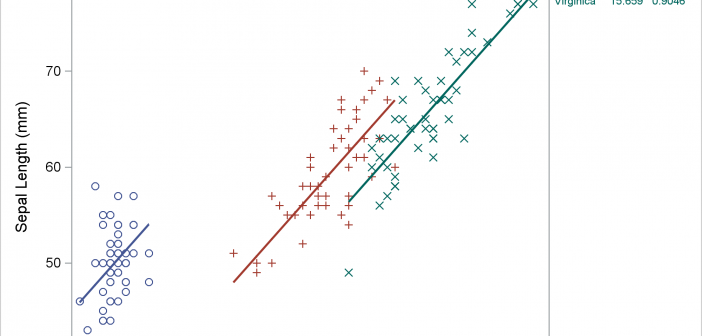
Usually, you use axis tables when there is a clear link between the rows of the axis table and the graph. I'll show how to use an axis table to create a table that is independent of the graph. This post also uses discrete attribute maps.
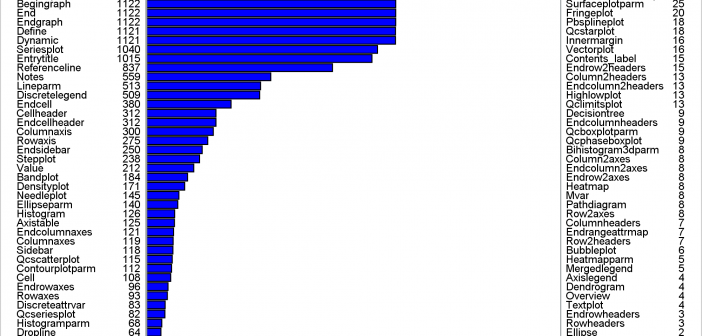
This post shows a variety of techniques including how to use PROC TEMPLATE and the SOURCE statement, PROC SGPLOT with multiple Y-axis tables, create comparable axes in two side-by-side graphs, create a broken axis, write and use a table template that wraps text, and find and display examples of certain statements in graph templates and fonts in style templates.
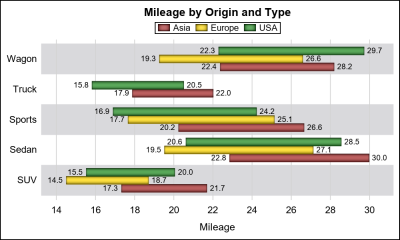
The ODS Graphics software, first released with SAS 9.2, supported creating graphs directly from statistical procedures. Prior to this, very few statistical procedures created graphs on their own, and in most cases creating graphs was a post process or creating the graphs from the saved data using SAS/GRAPH procedures. With