The coronavirus has been a big item in the news lately - it's a pneumonia-like illness that has killed several people. It's thought to have started in China, and has spread to several other countries (including at least one case in the U.S.). The World Health Organization says the coronavirus is not a global health emergency - at least, not yet. But that doesn't mean we shouldn't prepare for a global health emergency ... and by prepare, I mean writing computer code to track the spread on a map! Follow along as I demonstrate how to use some SAS tools to create such a map...
The Data
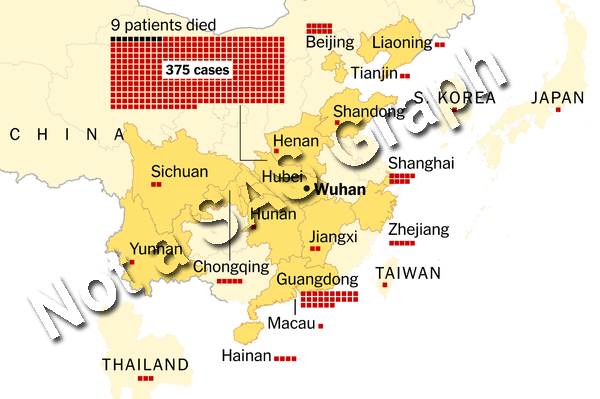
I don't work for the CDC or the W.H.O., and don't have access to the live/updated data for disease outbreaks, therefore I looked to the Internet to get enough sample data to write my proof-of-concept. I found an interesting map in a nytimes article, that had some data I could use. Here's a copy of their map - I can count the number of colored squares for each area to determine how many cases they've had.
Mapping Country Data
Let's start with the easy part - Japan, Thailand, South Korea, and Taiwan. These areas have separate polygons in the SAS mapsgfk.world map, and it's a simple matter to create a choropleth map using the names as the id. I set up the data like this:
data countries_data;
input cases deaths name $ 8-80;
my_id=name;
datalines;
1 0 Japan
1 0 Macau
3 0 Thailand
1 0 South Korea
1 0 Taiwan, Province of China
;
run;
I then generated a list of all the names, and used that list to subset just the polygons in the world map that I wanted.
proc sql noprint;
select quote(trim(left(name))) into :countries separated by ' ' from countries_data;
quit; run;
data countries_map (rename=(idname=my_id));
set mapsgfk.world (where=(idname in (&countries)));
run;
And now I can create a choropleth map, shading those areas based on the number of coronavirus cases. Notice that I overlay these choropleth polygons on top of a background map, so you can better see where these areas are located, with respect to the other countries/areas in this region of the world.
proc sgmap mapdata=countries_map maprespdata=countries_data;
esrimap url="http://services.arcgisonline.com/arcgis/rest/services/Canvas/World_Light_Gray_Base";
choromap cases / mapid=my_id;
run;
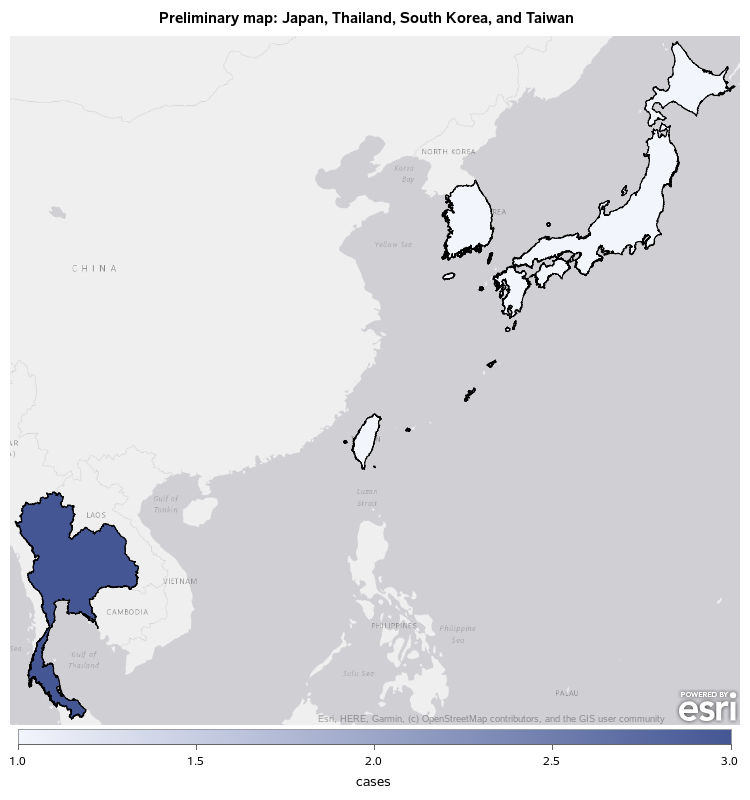
Notice that this map already has a slight improvement over the nytimes map. If you look closely at the nytimes map, you'll notice that Thailand and South Korea look like they're not connected to China by land (because the nytimes map does not show all the land areas) - that can be very deceptive! My SAS map shows all the land areas behind the overlaid colored choropleth polygons, which I consider a "best practice" that all map-makers should follow.
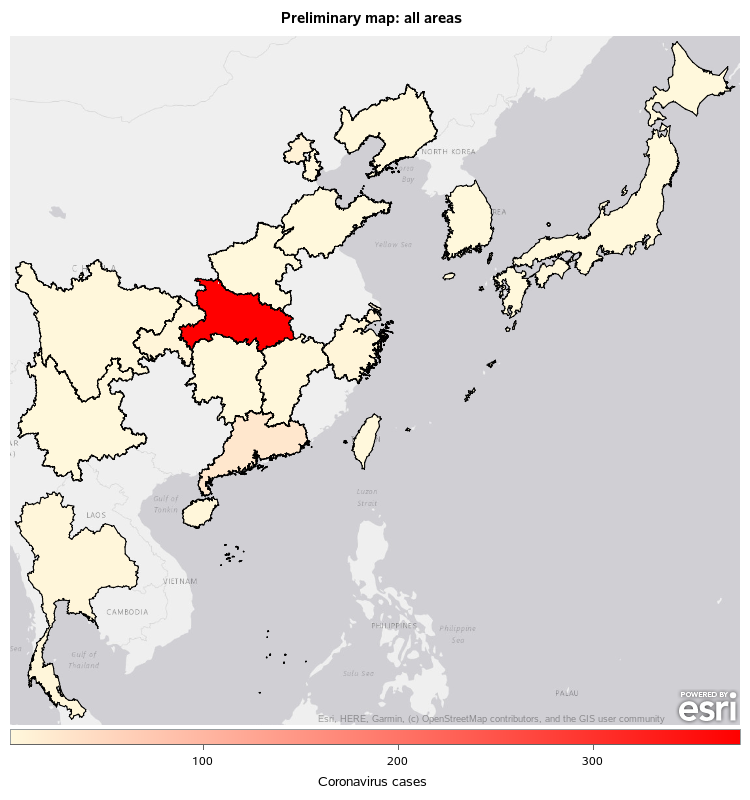
Adding China Data
Now let's add the provinces in mainland China. It would be fairly simple to plot the China provinces data, if that was all you wanted to do - but since we want to combine those polygons with the country polygons for Japan, Thailand, etc, that becomes more difficult.
We'll start by setting up the data as follows:
data china_data;
input cases deaths name $ 8-80;
datalines;
375 9 Hubei Sheng
2 0 Liaoning Sheng
10 0 Beijing Shi
9 0 Shanghai Shi
2 0 Tianjin Shi
5 0 Zhejiang Sheng
26 0 Guangdong Sheng
1 0 Shandong Sheng
1 0 Henan Sheng
2 0 Jiangxi Sheng
1 0 Hunan Sheng
2 0 Sichuang Sheng
5 0 Chongqing Shi
4 0 Hainan Sheng
1 0 Yunnan Sheng
;
run;
We next need to merge in the map id for each province (for example, Hubei Sheng's id is CN-42), because the mapsgfk.china map uses these id numbers, rather than the text names.
proc sql noprint;
create table china_data as
select unique china_data.*, china_attr.id1 as my_id
from china_data left join mapsgfk.china_attr
on china_data.name=china_attr.id1name;
quit; run;
We then get a list of all the id's with data, and subset the china map to just the areas of interest.
proc sql noprint;
select quote(trim(left(my_id))) into :provinces separated by ' ' from china_data;
quit; run;
data china_map; set mapsgfk.china (where=(id1 in (&provinces)));
run;
The China map polygons are actually one level more granular than what we need (provinces), therefore we need to use Proc Gremove to remove the internal polygon borders for the level within the provinces (this is like removing the county borders within states, to get a U.S. state map).
proc gremove data=china_map out=china_map (rename=(id1=my_id));
by id1; id id;
run;
We can now combine the two map datasets, and the two response datasets, and plot all the data on the map. Notice that I add a colormodel statement in the SGmap, to control the start and end colors in the legend (I specify a light yellow-to-red, rather than using the default shades of blue).
data my_map; set china_map countries_map;
run;
data my_attr;
set china_data countries_data;
run;
proc sgmap mapdata=my_map maprespdata=my_attr;
esrimap url="http://services.arcgisonline.com/arcgis/rest/services/Canvas/World_Light_Gray_Base";
choromap cases / mapid=my_id colormodel=(cornsilk red);
run;
Finishing Touches
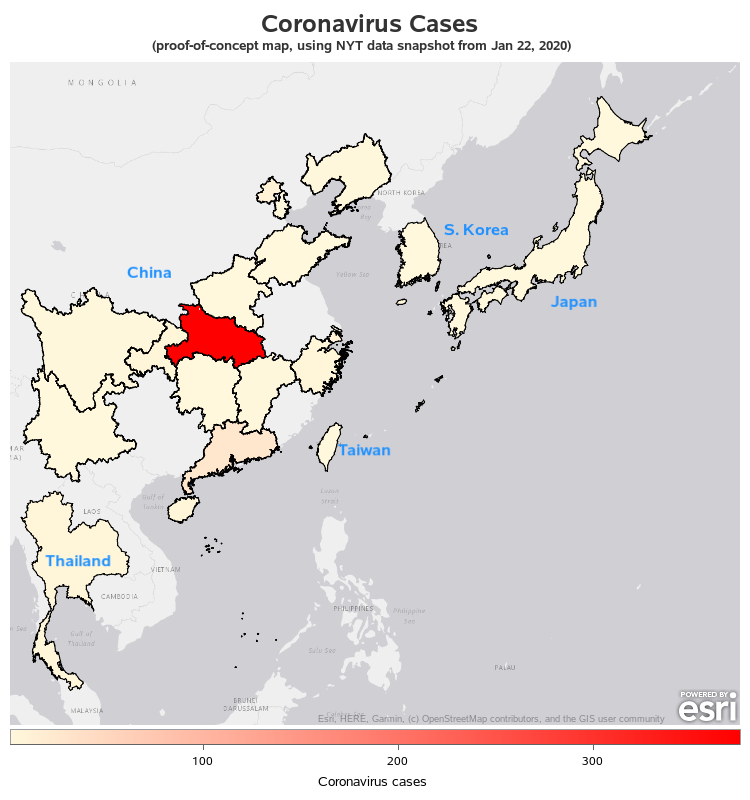
Some people would say "Yay - we're done!" But I'm not some people ... I'm a Graph Guy! And as a Graph Guy, I know this map isn't done. When you overlay choropleth polygons on a background map, you often obscure the labels on the map (or perhaps the background map didn't have the labels you wanted in the first place). I think this map would be much better with some country labels.
I could programmatically calculate the lat/long centroid of each map area and place the labels there, but I wanted a little more control than that. Therefore I selected the exact lat/long coordinates where I wanted the labels, and hard-coded them:
data country_names;
input lat long country_name $ 24-80;
datalines;
33.3684933 137.9375099 Japan
37.8507097 129.7470463 S. Korea
23.3540002 121.6184836 Taiwan
15.3247781 99.1174074 Thailand
35.2143691 105.3870128 China
;
run;
And then I used a text statement in my Proc SGmap, to overlay the text on the map.
proc sgmap mapdata=my_map maprespdata=my_attr plotdata=country_names;
esrimap url="http://services.arcgisonline.com/arcgis/rest/services/Canvas/World_Light_Gray_Base";
choromap cases / mapid=my_id colormodel=(cornsilk red);
text x=long y=lat text=country_name / position=right tip=none
textattrs=(color=dodgerblue size=12pt weight=bold);
run;
Bonus Points
Although I made a few improvements in my map (such as South Korea and Thailand not looking like they're islands), the nytimes map still has one advantage up to this point. By counting the number of colored blocks for each area, you could tell the exact number of coronavirus cases in each area. Whereas my map just has the colored shading, which only gives you an approximation.
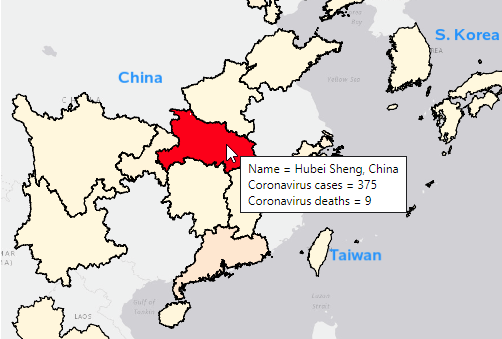
But wait! ... There's more! Although you can't tell from the static snapshot above, my map is actually interactive, and you can hover your mouse over the areas to see the exact values. I added this custom mouse-over text using the tip= option on the choromap statement. Below is a screen-capture example (and here's a link to the interactive version, if you'd like to try the mouse-over text).
choromap cases / mapid=my_id colormodel=(cornsilk red) tip=(name cases deaths);
Discussion
What other mapping techniques could be useful for tracking, and showing the spread of the coronavirus? Feel free to discuss in the comments section.
Here's a copy of the complete SAS code used to create the samples above, if you'd like to download it and experiment with creating your own maps. Note that this uses some very recently-added features, and therefore you'll need the latest version of SAS to run them (Viya 3.5).