I recently saw in several social media posts that sales of vinyl records are forecast to be higher than sales of CDs this year (2019) for the first time since 1986. Two questions came to mind - 1) Is this true? and 2) Is this a big deal? Let's analyze some data on the topic!...
Remember Vinyl?
Back in my college days, I did a bit of DJing ... and I used vinyl records. It was a lot easier to cue up 45s (which only contain one song per side), so I usually bought the 45s rather than albums. The vinyl records were heavy to carry (when you had a whole crate of them), and any dust/dirt/scratches would result in loud 'pops' when you played them. Therefore I was really glad when CDs came along - they were lighter and much easier to queue up ... and you could tell exactly how many seconds were remaining as it played. I still have all my old vinyl records, with many of the more decorative covers hanging on my living room wall.

And I even bought a vinyl album recently - a reprint of the Prince Purple Rain album, with the graphics pressed into the vinyl. I didn't really buy it to play, but I just wanted to have it. And it looks great sitting on my turntable:

RIAA Data
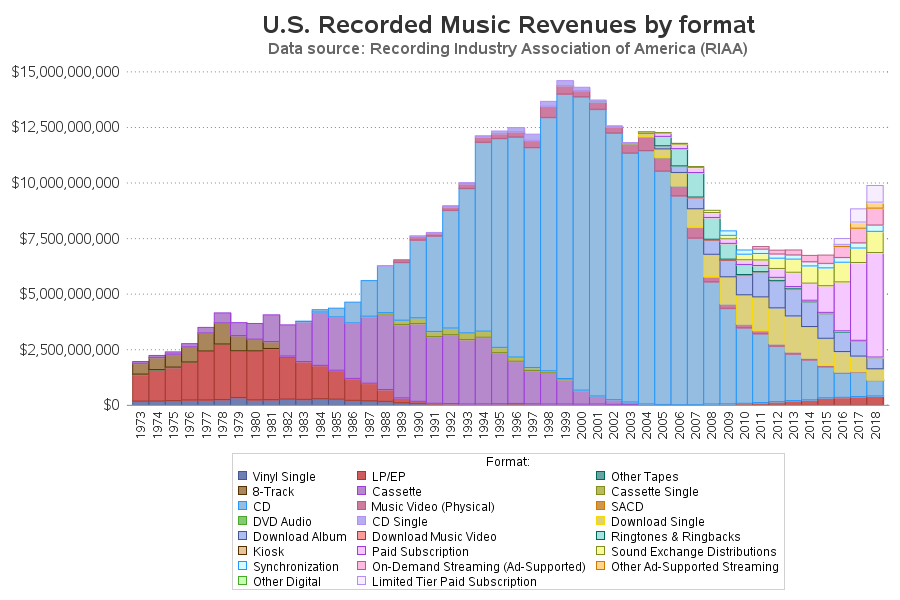
And now, back to the data analysis! The news reports cited RIAA (the Recording Industry Association of America) as the data source, so I went to their website, and found their data for past years. They had it presented in an interactive graph, where you could select any (or all) of the categories of data, and the year range, and view the graph. Here's a screen-capture:

Their graph is ~OK for visualizing data in a generic/generalized way, but I wanted to try creating a customized graph, that was a bit more targeted to making sense of this particular data.
My Comparable Graph
As a first step, I got the data into SAS, and created a graph similar to the one on the RIAA website. This was just a sanity-check, to make sure I had the same data, etc. I did make a few small changes though - for example,
- I didn't like that the left axis was in million dollars, and the tick values were over 1,000 - that way you have to calculate in your head that $14,000 million is actually $14 billion. I went ahead and expanded those numbers on out, and showed all the zeroes (that way the user doesn't have to do math in their head, and all those zeroes help reinforce the notion that it's a really big number).
- I 'stacked' the bar segments in the order in which the media formats became popular. This way, you can see the progression from the bottom/left to the top/right (whereas the original graph's progression went from the top/left to the bottom/right).
- And I added reference lines.
Simplified Graph
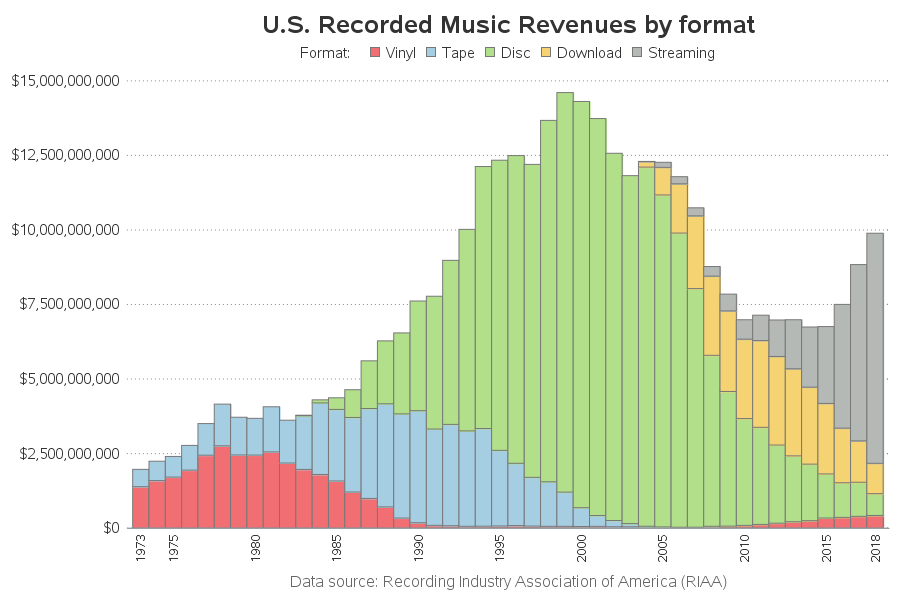
One thing you might immediately notice in the graph above is that there are too many colors to easily distinguish. Therefore I decided to group the formats into five categories (for example, Vinyl Singles and Vinyl LP/EPs are now grouped together, and CDs & CD singles & other types of music on disc are now grouped together). I also thinned out the values shown on the xaxis, showing only the 5-year increments. These small changes clean up the graph quite a bit.
Converting to Constant Dollars
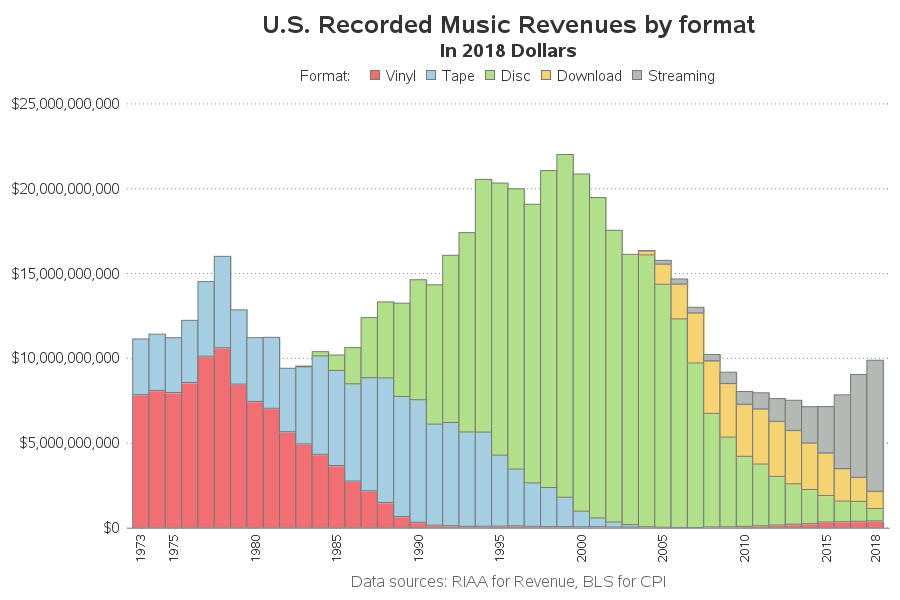
In the graph above, you can see that there was more revenue from CDs (disc) in 2000, and Streaming in 2018, than there was from Vinyl's peak around 1980. But is that comparison valid? ... What about inflation? In the 1970s and 80s, a dollar was worth a lot more than it is today. In order to make a fair comparison, we need to convert all the values to constant dollars. Therefore I downloaded the consumer price index, and converted all the revenue to "2018 dollars". Now it appears that the annual Vinyl revenue was actually higher than the Streaming revenue (the opposite of what it looked like in the previous graph)!
Dollars per Person
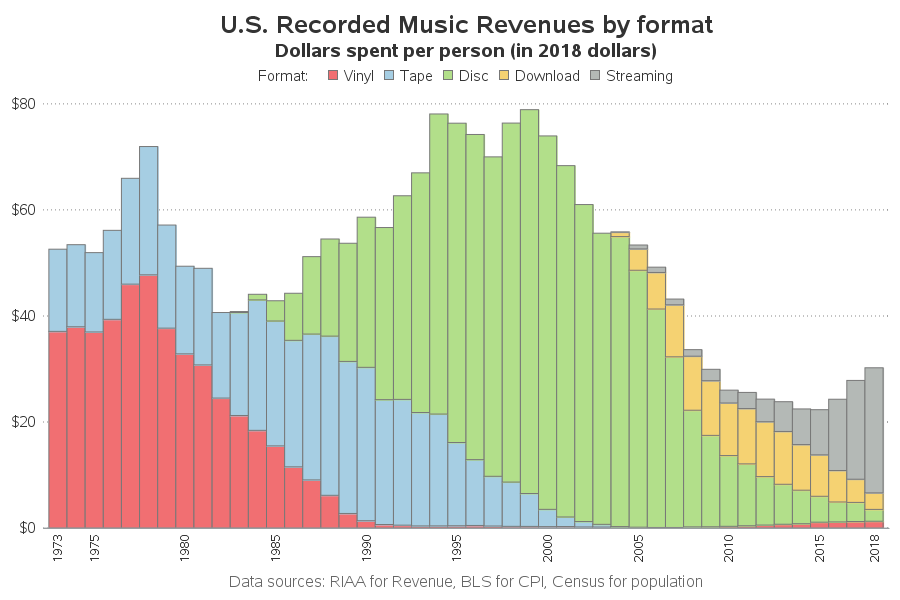
In addition to inflation changing the value of a dollar, the number of people in the US has also changed over this time span. Therefore it might also be interesting to see how many dollars of revenue was spent by each person (on average) each year. To do that, I merged in the population data, and calculated dollars spent per person. Now the Vinyl revenue in the 1970s & 80s is even higher, compared to the Streaming revenue in recent years.
Vinyl -vs- CD
The above bar charts give us a pretty good overall picture for the past few decades, but the data we're actually interested in (comparing recent Vinyl and CD sales) is just a tiny portion in the bottom/right corner of the bar chart. Let's subset the data, and create a line chart, which will be much better for comparing and forecasting.
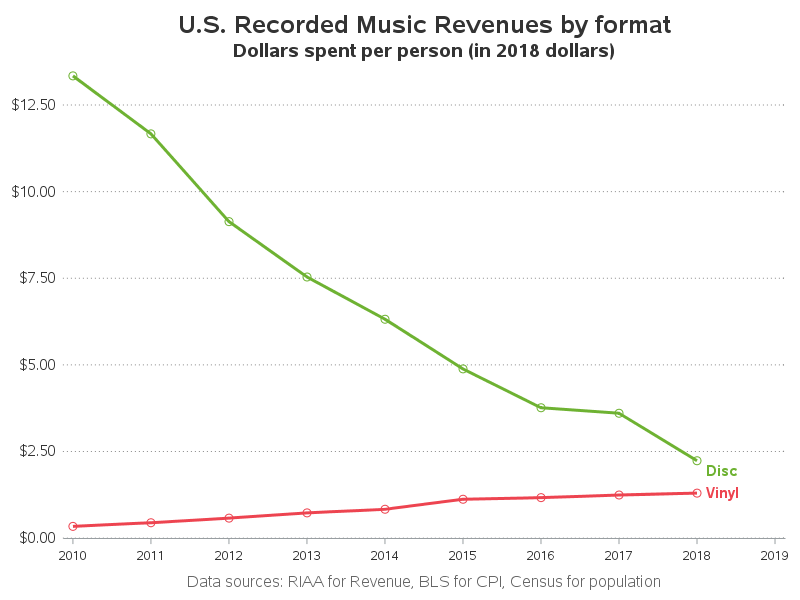
Conclusions
The original question was whether Vinyl sales will generate more revenue than CDs in 2019, and whether or not that's a big deal.
Well, looking at the final line graph, it appears that Vinyl revenue is increasing, and CD (Disc) revenue is decreasing. And it looks like Vinyl will indeed overtake CD sales sometime in the near future (maybe 2019, if the current trends continue). And the bigger question - is it a big deal? Well, in the grand scheme of things, both Vinyl and CD sales are pretty small - at this point I would call them both niche markets, and it's probably not that big a deal which of them sells the most. 🙂
If you're a SAS programmer, and would like to see all the code ... here it is!

4 Comments
Hey, Robert did you have to download the data into Tableau first? I wanted to forecast this data to estimate when/if vinyl will overcome CD's, but couldn't find the Excel file.
I did it the manual/hard way ... moused-over each bar segment, and entered the data into my own spreadsheet ... by hand. :\
Yesterday, I talked to a younger friend (20 years old) about vinyl records. She said she plans to buy several vinyl records of her favorite music. She has a new/modern turntable (that you can plug into a computer to play it, convert your vinyl album to an mp3, etc). She said that one day, when she has kids, she plans to play "her music" for them on a turntable, like her parents introduced her to their music. This is just one data point, of course - but perhaps these are some factors contributing to the recent increases in vinyl sales.
The numbers make it clear that "the vinyl revival" is just RIAA hype and marketing. The units of vinyl sold are abysmal compared to when it was the leading media format, so it's beyond niche, it's more like a novelty. Streaming and digital downloads are also skewed and biased data because they take into account the millions of random amateur musicians who pay out of pocket just to get their music on digital distribution platforms and then make just a few pennies.