It's that time of year again - the summer is coming to a close, and students are heading to college... And starting the clock ticking on accumulating that student loan debt!
Before we get started, here's a little something to set the stage for this topic. This is a picture of my friend Pam (who I met in college, back in the day), and her daughter who recently graduated from college. Has it been that long?!? - my how time flies!

Original Map
And how did I choose the topic of student loan debt? I came upon this article, and both the topic and the map caught my attention. Here's a screen-capture of their map:
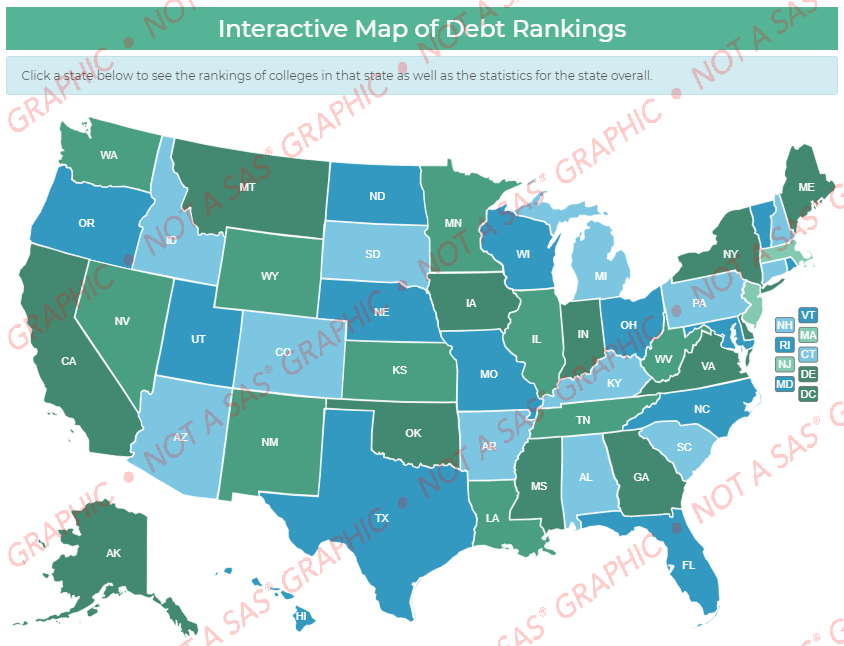
But the map caught my attention for a bad reason - I couldn't figure out what it meant! What did the colors represent? Were the states with 'good' values blue, or green? I first thought maybe the colored squares to the right were a legend, but they're actually just color-boxes for the states that might be too small to otherwise see. I quickly gave up on trying to understand their map, and set out to create my own map that would be more intuitive!
Cleaning the Data
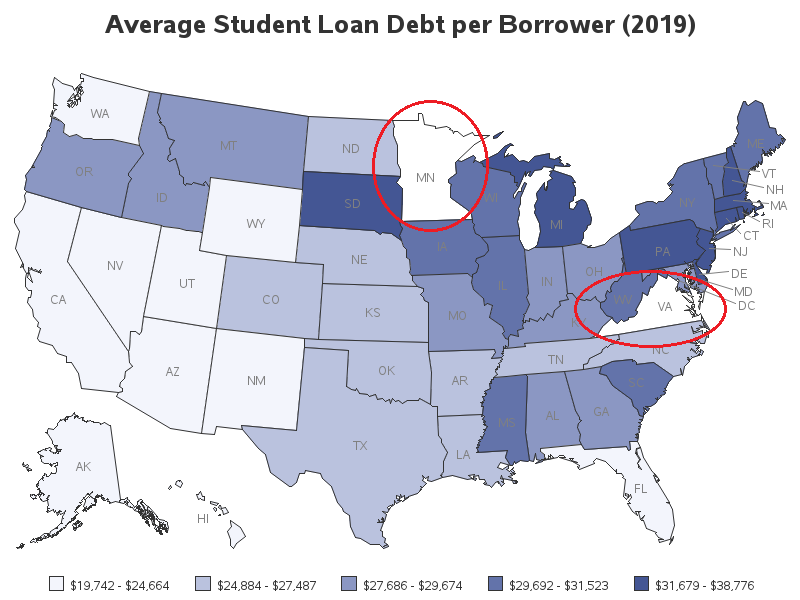
I downloaded their data csv file, imported it into SAS, and created a preliminary map. At first glance the map seemed pretty reasonable. But upon closer examination, I noticed that two of the states looked a bit lighter than the lightest shade in the legend (I've circled them so you can more easily see which ones they are.) They were actually white - which meant that there was no matching data for that state. This makes the map potentially misleading, since people might assume that 'white' is the lowest color in the gradient legend.
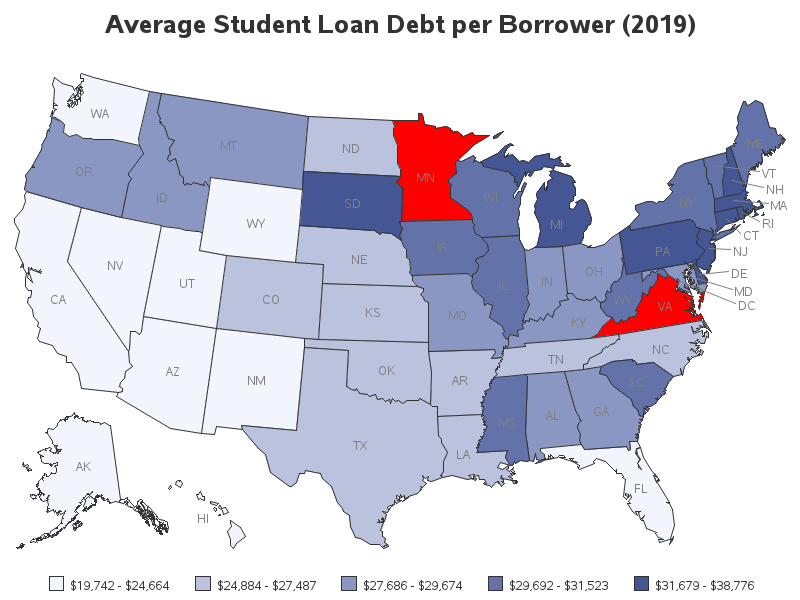
It takes a keen eye, and knowing what to look for, to notice the potentially deceptive white states in the gradient map above. But there's also an easier way to catch this type of problem. You can use the somewhat new cdefault= option, which makes map areas with no match in the data show up in a totally different color (I chose red, since the gradient was blue). Now the state(s) with missing values in the data don't show up as potentially-deceptive white. This makes it much easier to see that there is a problem with Virginia and Minnesota.
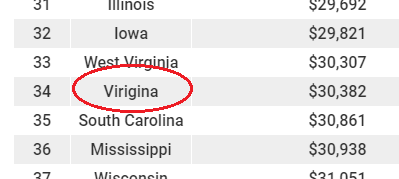
I investigated the data, and soon found the problems. First, they had misspelled Virginia in their table:
The problem with Minnesota was a bit more difficult to find. It looked OK most ways I viewed their data. But when I viewed their csv file in the 'vi' editor in Unix, I finally noticed what was wrong. There was a character appended on the end of Minnesota - it was 'invisible' most of the ways I viewed the data, but the 'vi' editor showed it to me. (Never underestimate the powers of good old 'vi'!)

I used a SAS data step to fix these two state names, and also change DC so that it would match the way we spell it in the SAS map. DC was also red in the map above, but too small to really see.
data state_data; set state_data;
if state_name='Virigina' then state_name='Virginia';
if index(state_name,'Minnesota')^=0 then state_name='Minnesota';
if state_name='Washington D.C.' then state_name='District of Columbia';
run;
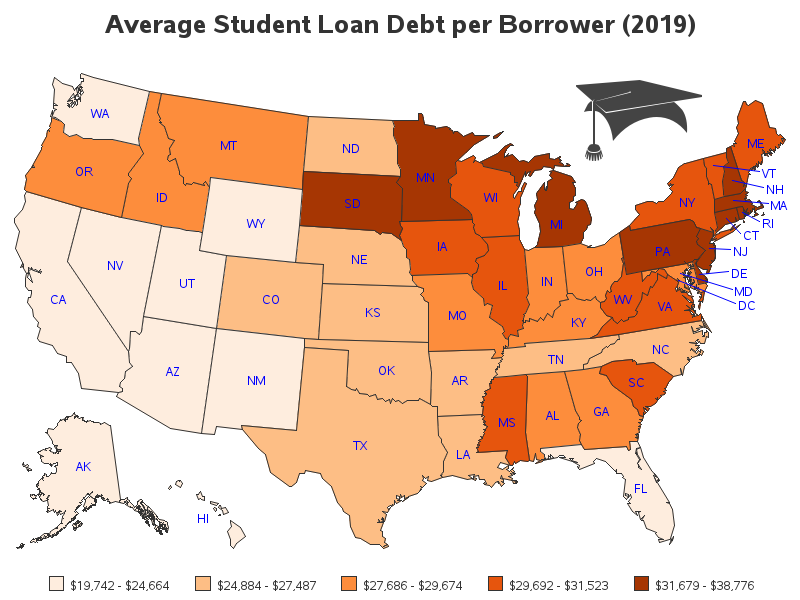
Final Map
Now all the areas in the map have data! Below is my final version. I decided to use gradient shades of red, rather than the default/blue shades - this way the states with the highest student loan debt per borrower are dark red (which is intuitive for 'bad').
And one extra feature - the interactive version of the map has drill-down capability. You can click a state (or the state name label) in the map to see a list of the colleges/institutions in that state which were in the highest 250, or lowest 250 list. For example, here's a screen-capture of the drill-down table for North Carolina:

Did your college make the list of highest (or lowest) student loan debt? What do you think is causing such high numbers, in general? Feel free to discuss in the comments...
If you'd like to see all the details of how I created this map, here is the full SAS code.


2 Comments
Excellent! Thanks for sharing this, Robert! I'm curious if online institutions were included in the database because I would think they would be among some of the highest in student loan debt.
Additional, "non-printable" characters or leading spaces cause issues occasionally. The following snippet of code stays in my DUT folder:
42 data _null_ ;
43 state = " Minnesota" || "09"x ;
44 put state= ;
45
46 length byte $ 1 ;
47
48 do _n_ = 1 to length( state ) ;
49 byte = substr( state , _n_ , 1 ) ;
50 put _n_= z3. byte= byte= hex. ;
51 end ;
52
53 non_printable = compress( state
54 ,
55 , "W"
56 ) ;
57 put non_printable=
58 / non_printable= hex.
59 ;
60
61 run ;
state=Minnesota
_N_=001 byte= byte=20
_N_=002 byte=M byte=4D
_N_=003 byte=i byte=69
_N_=004 byte=n byte=6E
_N_=005 byte=n byte=6E
_N_=006 byte=e byte=65
_N_=007 byte=s byte=73
_N_=008 byte=o byte=6F
_N_=009 byte=t byte=74
_N_=010 byte=a byte=61
_N_=011 byte= byte=09
non_printable=
non_printable=0920202020202020202020
One might add TRIM() to the NON_PRINTABLE assignment to reduce the finding to just the characters of interest ("20"x, space, is printable); adding "S" to the modifier list would remove the tab, too. Notice that I added the tab using its hex representation "09"x. I set my Enhanced Editor to replace tabs in the program since they can cause problems between interactive and batch submissions so the tab key within the string was not an option. As a practice, then, I use the hex representation for tabs and I use the REPEAT() function to write two or more since one can more easily assess how many tabs are present, but it also allows readers to see what a tab looks like in the byte-by-byte display (one typically does not create the problematic string, but someone using the HEX. format is probably initiated with hex values).