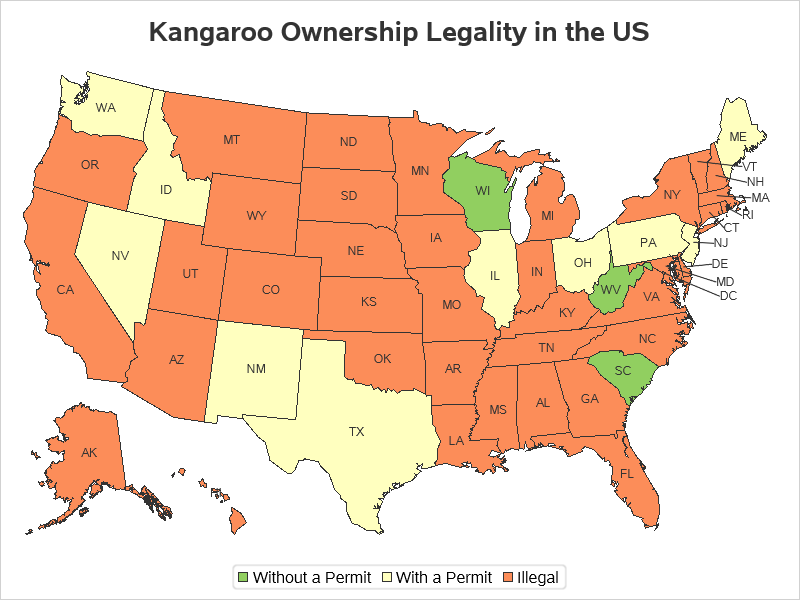
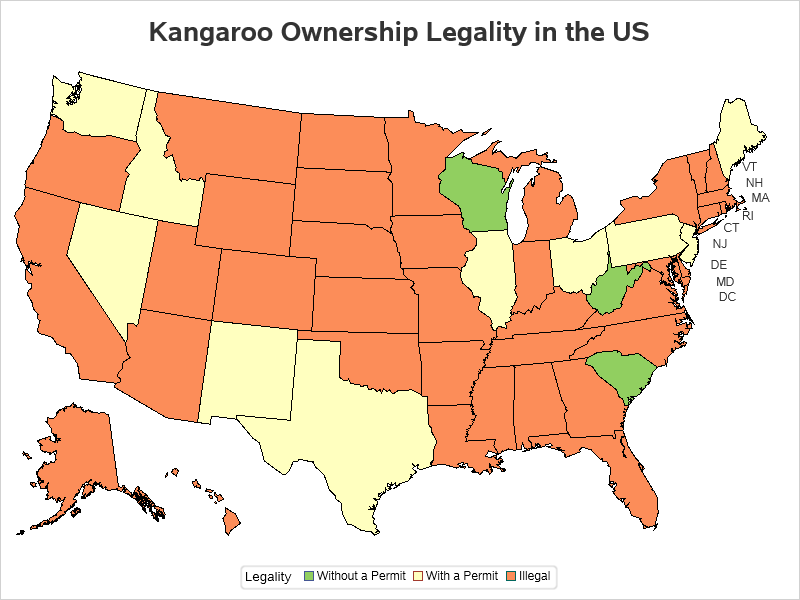
I saw an interesting kangaroo map on reddit, and although the data was deemed "not entirely reliable" it seemed like a fun topic. And also a good exercise to try out the map labeling capabilities in the new Proc SGmap choropleth maps in SAS! For those of you not really into coding, here's my final map:
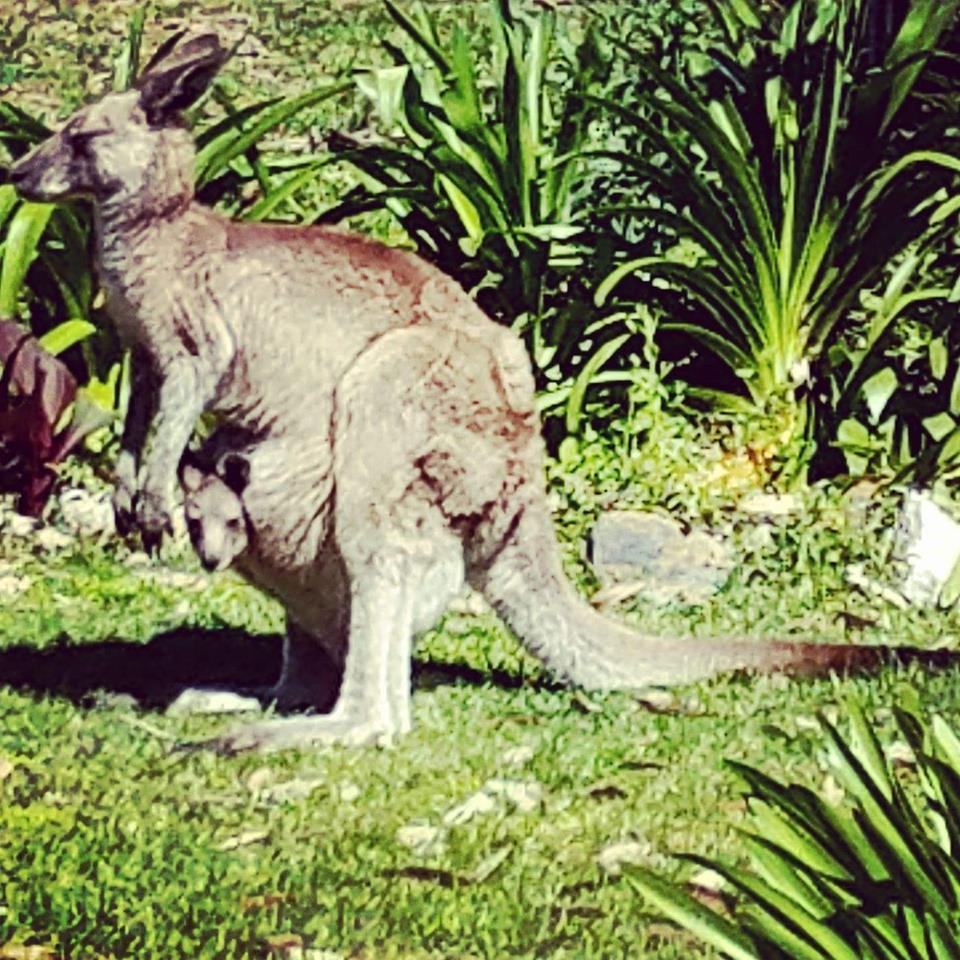
For those of you not familiar with kangaroos, here's a picture of one from my friend Eva. Eva lives in North Carolina, therefore (according to the map) she does not have this kangaroo as a pet at her house ... or does she?!? Hmm... 😉
How'd he do that?
First, I had to create a dataset with a value for each state, indicating the legality of owning a kangaroo. I assign these with a few 'if' statements, and then sort the data so the legend (and color assignment) will be in a logical/predictable order.
data my_data; set mapsgfk.us_states_attr;
length Legality $50;
if statecode in ('SC' 'WV' 'WI') then legality='Without a Permit';
else if statecode in ('WA' 'ID' 'NV' 'NM' 'TX' 'IL' 'OH' 'PA' 'NJ' 'ME') then legality='With a Permit';
else legality='Illegal';
run;
proc sort data=my_data out=my_data;
by descending legality;
run;
Now I can plot the data on a US map with the following simple code:
title1 "Kangaroo Ownership Legality in the US";
proc sgmap maprespdata=my_data mapdata=mapsgfk.us;
choromap legality / mapid=statecode;
run;
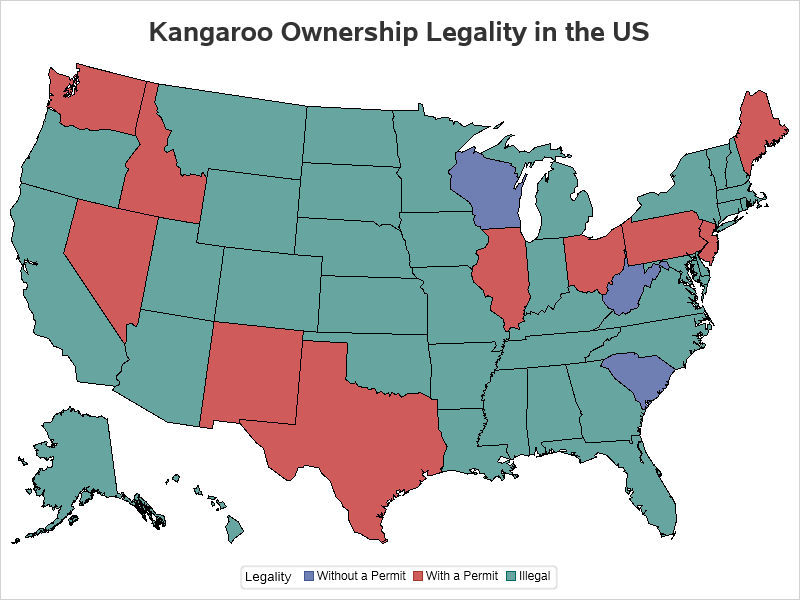
The default colors aren't all that intuitive in this case, therefore I modified the ODS style to use some custom colors I picked with the assistance of the colorbrewer website:
ods path(prepend) work.templat(update);
proc template;
define style styles.roo;
parent=styles.htmlblue;
class graphcolors /
'gdata1'=cx91cf60
'gdata2'=cxffffbf
'gdata3'=cxfc8d59;
end;
run;
ODS HTML style=roo;

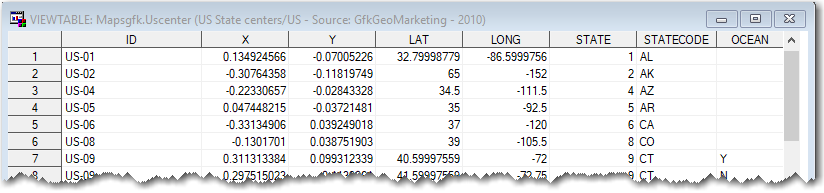
Do you remember all 50 US states by sight? Perhaps it's been a while since you learned these in grade school ... Therefore let's add some labels to the map. SAS ships a 'mapsgfk.uscenter' dataset, containing the X/Y center of each state in the 'mapsgfk.us' map. For the small states in the northeast, there is also an X/Y in the ocean, as an alternate location for a label.
Let's start by adding text labels for the larger states that can hold their label in the center (ie, they don't need to use the label location in the ocean).
data land_labels; set mapsgfk.uscenter (where=(ocean=''));
land_x_text=x;
land_y_text=y;
run;
proc sgmap maprespdata=my_data mapdata=mapsgfk.us plotdata=land_labels;
choromap legality / mapid=statecode;
text x=land_x_text y=land_y_text text=statecode / position=center textattrs=(color=gray33 size=9pt);
run;

And similarly, some labels for the X/Y positions that are in the water (for the states that are too small to fit the label inside the state). Note that I am positioning this text to the right of the water X/Y location (rather than the center), so that they will not overlap with the line segment I'll be drawing in the next step.
data water_labels; set mapsgfk.uscenter (where=(ocean='Y'));
water_x_text=x;
water_y_text=y;
run;
proc sgmap maprespdata=my_data mapdata=mapsgfk.us plotdata=water_labels;
choromap legality / mapid=statecode;
text x=water_x_text y=water_y_text text=statecode / position=right textattrs=(color=gray33 size=9pt);
run;
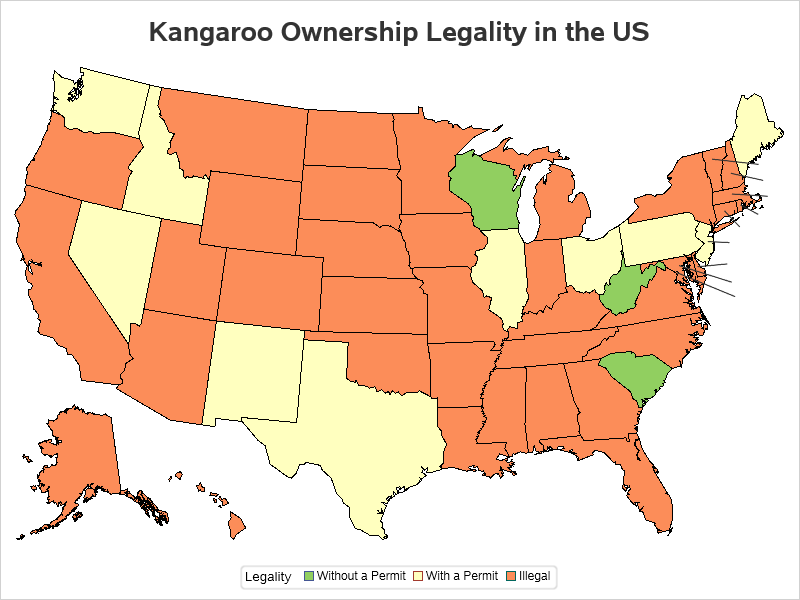
And then, some lines to connect the labels that are in the water, back to the center of their state. After each state's line segment, I insert a 'missing value' (denoted by a period/dot) to cause a break in the line. I use a series statement to draw the line segments.
data lines; set mapsgfk.uscenter (where=(ocean^=''));
by statecode notsorted;
x_line=x;
y_line=y;
output;
if last.statecode then do;
x_line=.;
y_line=.;
output;
end;
run;
proc sgmap maprespdata=my_data mapdata=mapsgfk.us plotdata=lines;
choromap legality / mapid=statecode;
series x=x_line y=y_line / lineattrs=(color=gray33);
run;
And as a final step, combine all 3 datasets into one, to overlay the text and lines all on the same map. Note that this is why I use a different name for the X/Y variables - so that I can combine them all into one dataset, but still plot them independently of each other. This technique is 'overloading' the dataset (which produces a dataset with lots of extra X/Y variables, and blocks of 'missing' values), but it's the only technique we can use to label the map until sganno (annotation) is supported in Proc SGmap. Once sganno is supported, we can keep the same X/Y variable names, and then specify the desired function values in the data.
data my_labels; set land_labels lines water_labels;
run;
proc sgmap maprespdata=my_data mapdata=mapsgfk.us plotdata=my_labels;
choromap legality / mapid=statecode;
text x=land_x_text y=land_y_text text=statecode / position=center textattrs=(color=gray33 size=9pt);
text x=water_x_text y=water_y_text text=statecode / position=right textattrs=(color=gray33 size=9pt);
series x=x_line y=y_line / lineattrs=(color=gray33);
run;
Do you know of any exceptions/corrections for this kangaroo map? Do you know of anyone who owns a pet kangaroo? (Feel free to leave a comment to discuss!)


2 Comments
When I first looked at the graph I thought the orange colour represented the states where kangaroos could be pets!!! Legends are helpful
I’m surprised to learn it’s possible to have a kangaroo as a pet without a permit. That’s not allowed in Australia https://www.lifehacker.com.au/2018/10/is-it-legal-in-australia-to-keep-a-kangaroo-as-a-pet/
More intuitive colors might be red for illegal, green for without a permit, and amber for with a permit.