With the US census coming in 2020, I've decided to sharpen my skills at graphing census data. And today I'm working on creating a population pyramid chart to analyze the age and gender distribution. Follow along if you'd like to see how to create such a chart ... or jump to the end to see the final chart!
Raw Data
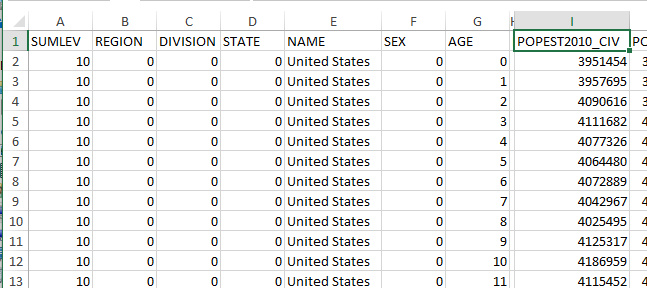
First, you'll need some data. I'm using the 2010 data, and hopefully the 2020 data will likely be structured very similarly. I went to the Census data page, selected the datasets link, and downloaded the csv file for the "Single Year of Age and Sex Population Estimates: April 1, 2010 to July 1, 2017 - Civilian". I opened it in Excel, and then saved it as an xls spreadsheet. Here's a sample of what the original data looked like:
Transformed Data
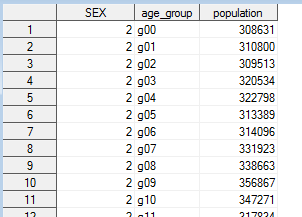
I imported the data using the code below, and then subset to just the columns I wanted. Next I limited the data to the desired state (in this case North Carolina), transposed the data so that each age became a separate column, used SQL to create new variables that grouped the columns into the desired age groups, and then transposed the data again to get it structured such that I could create a stacked bar chart. There are probably a dozen other ways you could have transformed the data to achieve similar results, but here's a link to my SAS code if you'd like to see the details (perhaps you can even recommend some improvements!)
proc import out=pop_data datafile="sc-est2017-agesex-civ.xls" dbms=xls replace;
getnames=yes;
run;
Preliminary Graphs
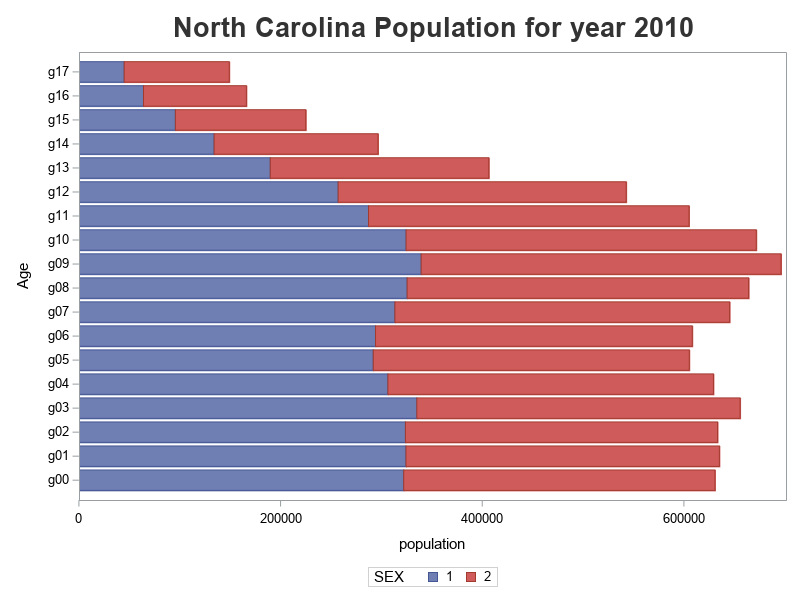
I can now create a simple stacked bar chart, where each bar represents and age group, and the colored bar segments represent the gender (male or female), using the following minimal code:
proc sgplot data=both;
hbarparm category=age_group response=population /
group=sex groupdisplay=stack;
yaxis reverse;
run;
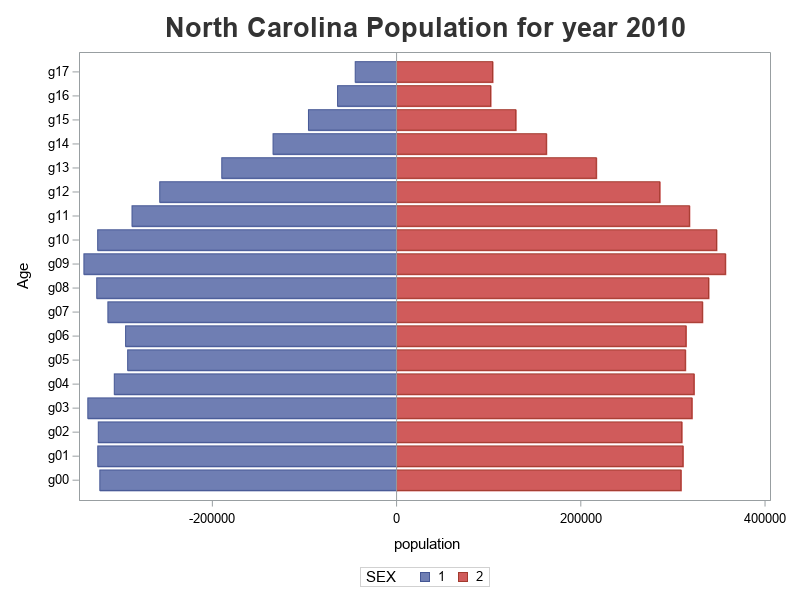
But a pyramid plot needs a line down the middle with the bars for each of the two groups going out left & right from that center line. To accomplish this, I multiply the male population values by -1.
data left; set left;
population=-1*population;
run;
Now let's work on the values shown along the axes. We had to make the male values in the data negative to have them plot to the left of the axis, but we don't want the values to show as 'negative' in the graph. Therefore we can set up a user-defined-format to make the negative values print as positive.
proc format;
picture posval low-high='000,009';
run;
I set up the age group category names as g00 - g17 so they will plot in the desired order, but I want those values to show as something more meaningful when they are printed along the axis. Therefore I again use a user-defined-format.
proc format;
value $agefmt
"g17"="85+"
"g16"="80-84"
"g15"="75-79"
"g14"="70-74"
"g13"="65-69"
"g12"="60-64"
"g11"="55-59"
"g10"="50-54"
"g09"="45-49"
"g08"="40-44"
"g07"="35-39"
"g06"="30-34"
"g05"="25-29"
"g04"="20-24"
"g03"="15-19"
"g02"="10-14"
"g01"="5-9"
"g00"="0-4";
run;
And the original data used 1 for Male and 2 for Female - but I would rather have the words show up in the legend than the numbers, therefore I also create a user-defined format for that:
proc format;
value sexfmt 1="Male" 2="Female";
run;
Here's what the graph looks like with these user-defined-formats applied:
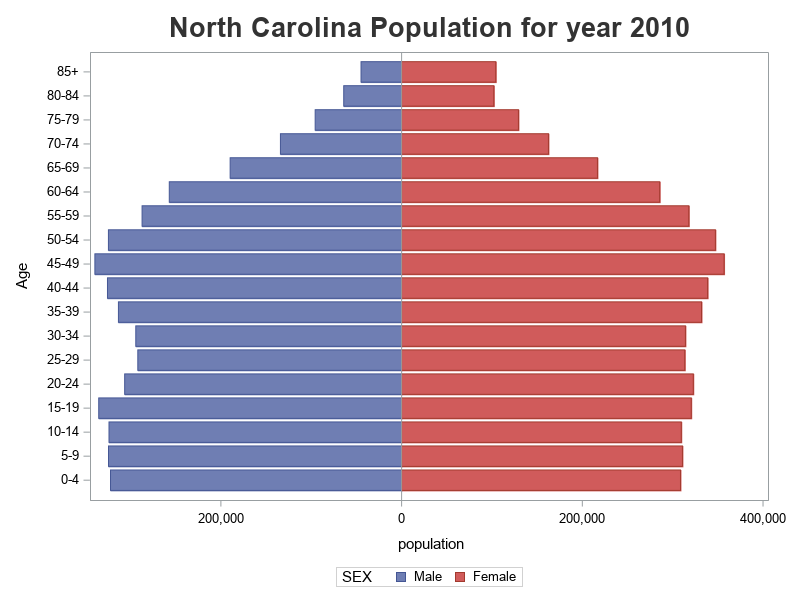
Final Graphs
And for a finishing touch, I specify mnemonic colors (blue and pink) for male and female, hard-code the population axis so it extends to the same number on the left and right of the zero line, and annotate Male and Female labels rather than using the color legend.
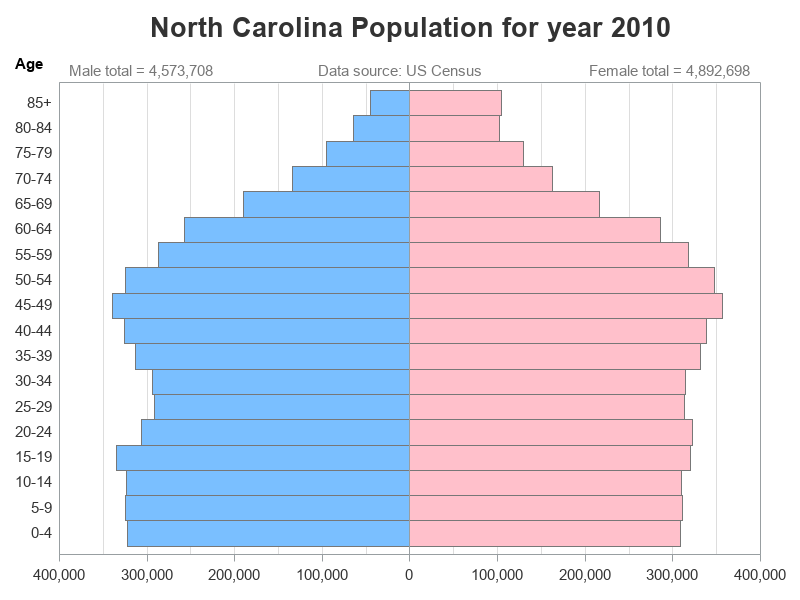
That's a pretty decent pyramid chart, and similar to most of them I've seen online ... but it still seems a bit lacking. For example, I find it difficult to locate a bar on the right-side (pink), and visually follow from that bar segment to figure out which label (age group) along the left side of the graph goes with it. Therefore I added a y2axis along the right-hand side, and also added alternating white and gray colorbands to the yaxis - now it is much easier to visually follow along from left-to-right and right-to-left. I'm pretty happy with the final result!
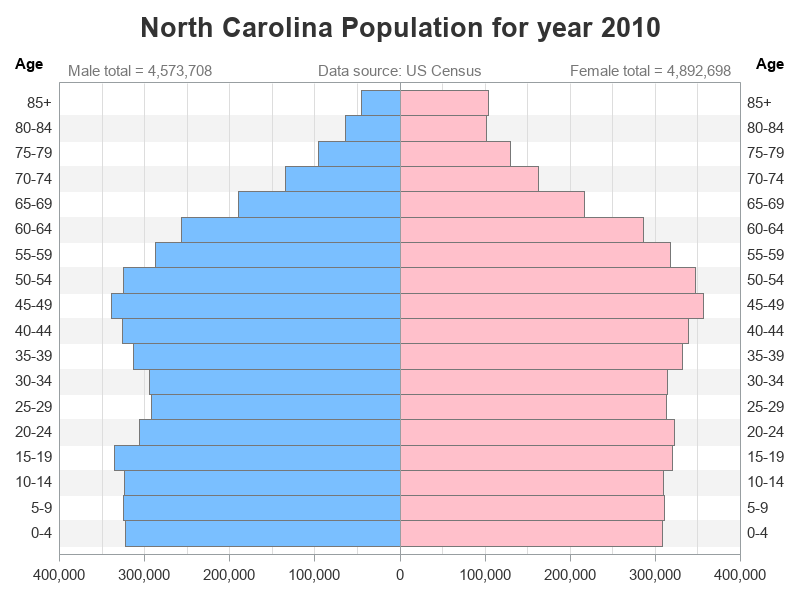
Here's a link to the code, if you'd like to try to re-create this graph for your own state!


10 Comments
This is a "blast from the past" because one of my first blog posts (2010) dealt with visualizing cell phone use by age groups. I'll bet those numbers have changed a LOT since 2010!
The pyramid plot is also called a "butterfly plot." Sanjay discussed several versions of butterfly plot. As you've shown, it is useful to use PROC FORMAT to bin a continuous response variable. For an example that relates butterfly plots and comparative histograms, see "A butterfly plot for comparing distributions."
Nice example. Well laid out for the steps you have to make. I have a book in my shelf Called SAS Graphs by example Version 6 from 1993. This has the same type of example in Example 16. I briefly looked at this. Interesting is that the data preparation steps are more of less the same even if the techniques for producing the graphs are completely different. Also looking at old examples makes you realize that life is a bit easier with SGPLOT and SGRENDER than it used to be.
That's my favorite SAS book! 🙂
I had posted the same population pyramid last year in the Valentine challenge:
https://communities.sas.com/t5/Graphics-Programming/Challenge-for-SAS-Nerds-Build-a-SAS-Valentine/m-p/436974#M15067
Aroop Ghosh
Ottawa
I posted the population pyramid last year in response to the nerd Valentine challenge:
https://communities.sas.com/t5/Graphics-Programming/Challenge-for-SAS-Nerds-Build-a-SAS-Valentine/m-p/436974#M15067
Sociologists use this technique to illustrate the Malthusian theory of population growth and demographics.
I like the colorband option for readability.
When I ran the code, I noticed a couple of warnings that regular is an invalid value for the TEXTWEIGHT option. Use TEXTWEIGHT='normal' to avoid the warnings.
Thanks for the heads-up! ... I've fixed that in the code now!
Pingback: Gifts to give the SAS fan in your life - SAS Users
Pingback: Improving a population pyramid animation (Sweden, 1860-2020) - Graphically Speaking
Pingback: The Graph Guy is retiring! - Graphically Speaking