The ODS Graphics software, first released with SAS 9.2, supported creating graphs directly from statistical procedures. Prior to this, very few statistical procedures created graphs on their own, and in most cases creating graphs was a post process or creating the graphs from the saved data using SAS/GRAPH procedures.
With SAS 9.2, many SAS procedures adopted the Graph Template Language (GTL) to create graphs directly. At that time, GTL feature set was geared towards the needs of the procedure writers, with emphasis on statistical plots and sophisticated features for layout of multi-layered and multi-cell graphs. The SG procedures were released to provide an easier access to the GTL functionality.
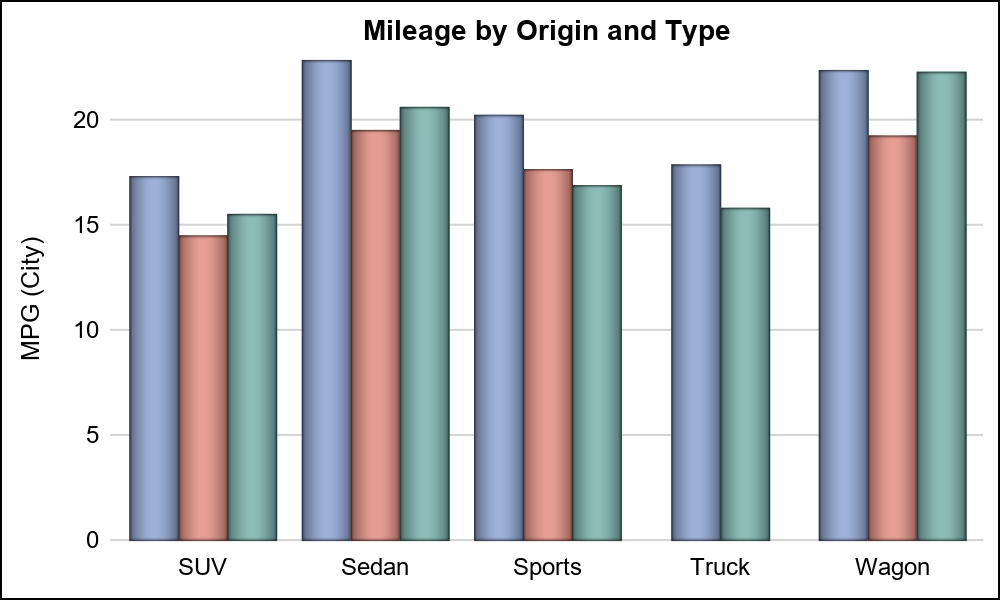
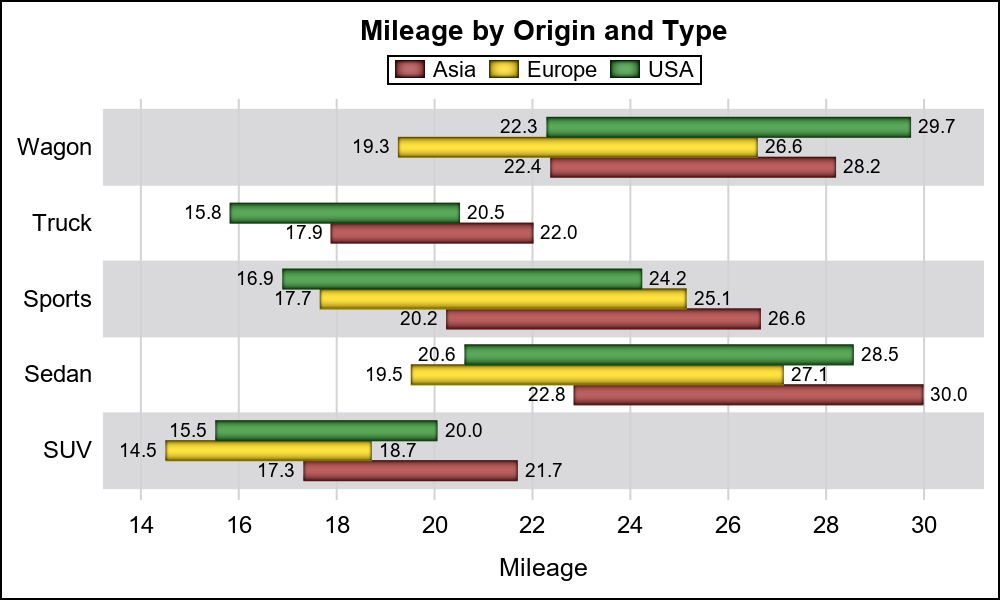
With SAS 9.3 and maintenance releases, many features were introduced to make creating graphs easier for SAS users. Let us review some of these such as Cluster Groups and HighLow plots.
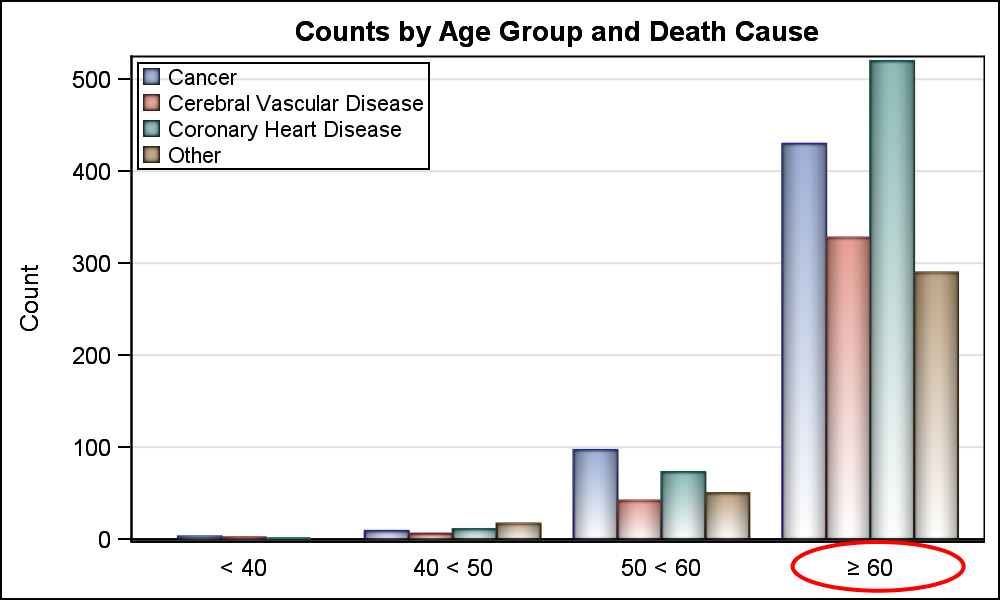
Discrete Attributes Map and SG Annotate were also introduced to make it possible to create all kinds of graphs. With SAS 9.3 and maintenance releases it was possible to create all sorts of graphs.
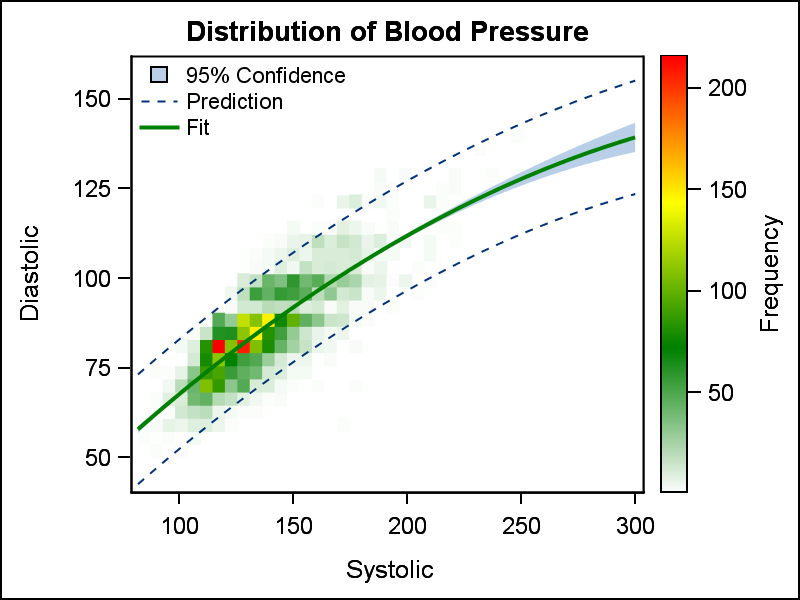
With SAS 9.4 and its maintenance releases it was our goal to make creating graphs easy. These releases saw the introduction of many new features including Heat Maps, Polygon plot, Text plot, Image markers, Axis tables, Style attributes, multiple classification in Series, Spline plots, label splitting, Unicode values and more. Now, most graphs are very easy to create using the "Layered" approach used with SG procedures and GTL, without need for annotation. Here are some examples.
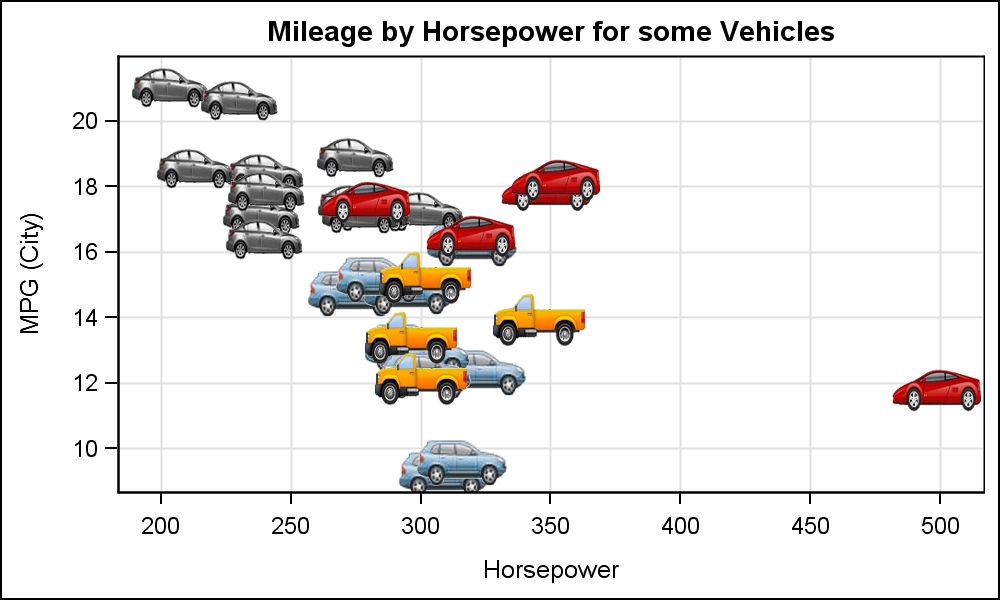
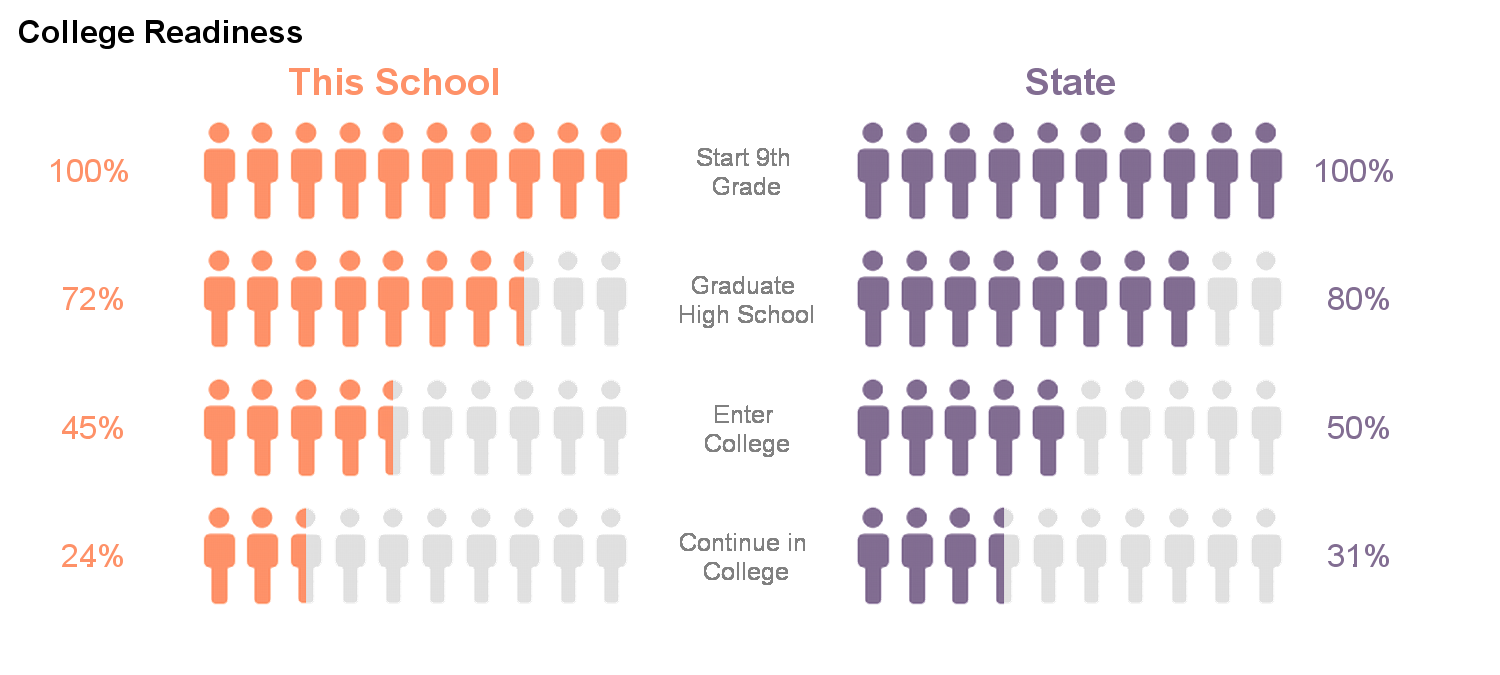
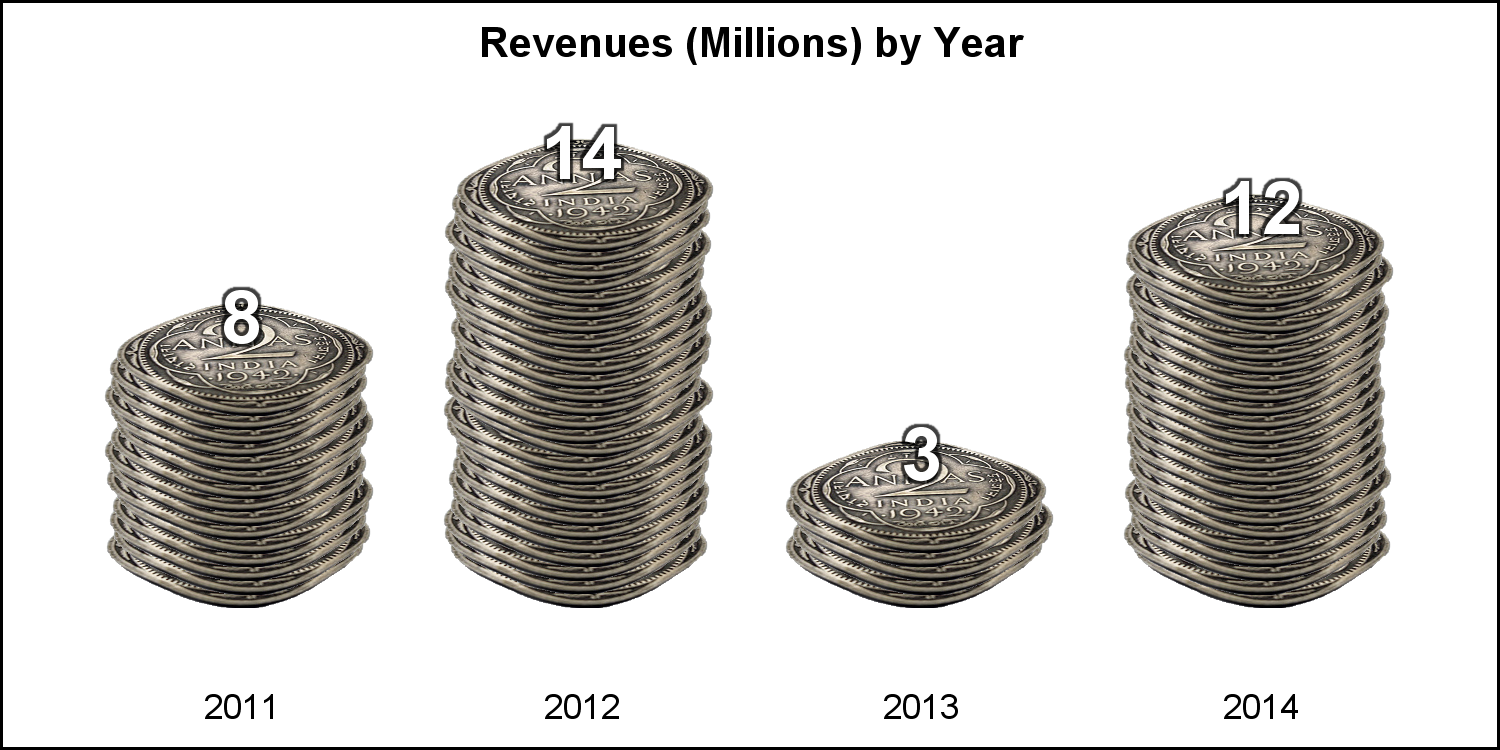
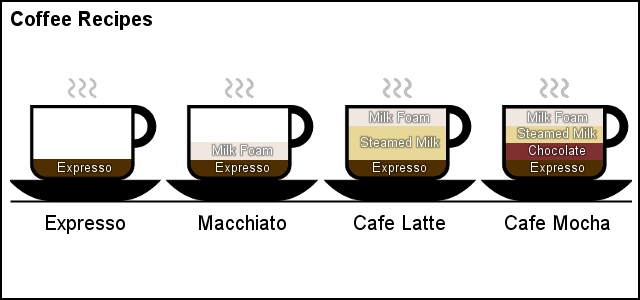
Creative use of image markers allows building "Info Graphs" that are suitable for usage in marketing or social media communication as shown here.
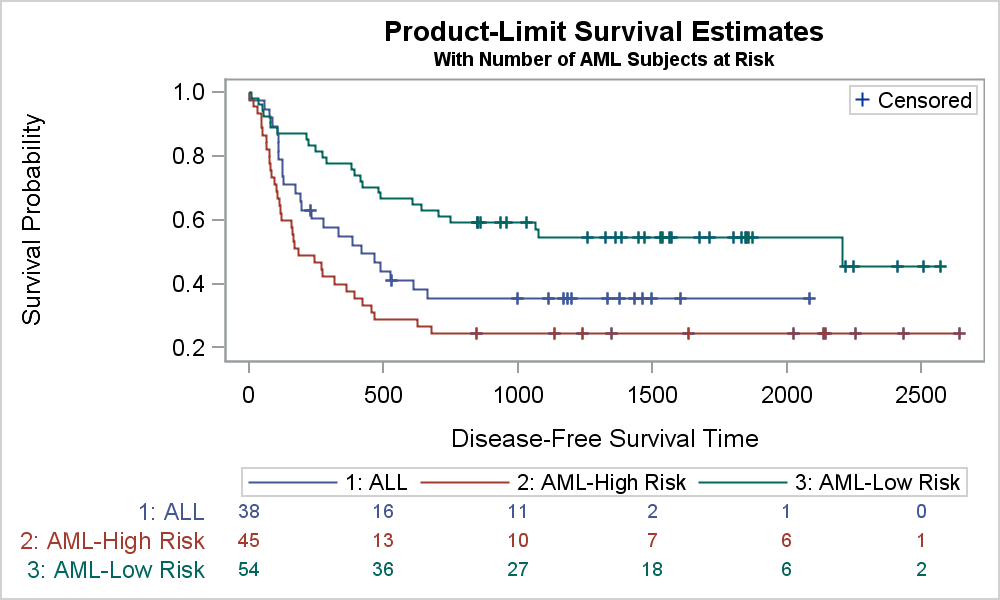
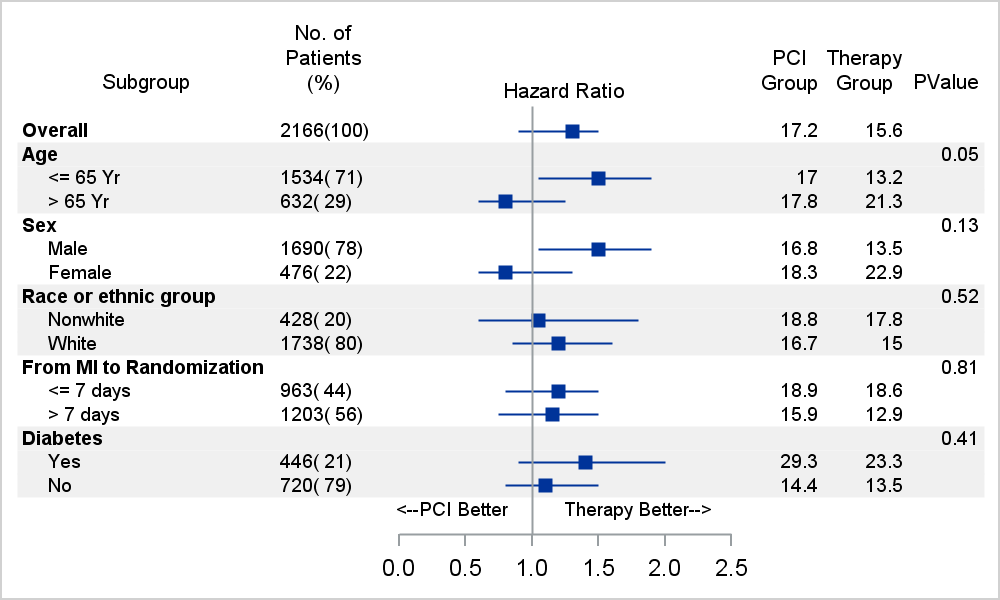
A large segment of SAS users in the Health Sciences domain have needs to create complex graphs for analysis of clinical trials data and other health care data. Many features introduced in SAS 9.4 releases cater to their needs to create such graphs easily. Here are some examples.
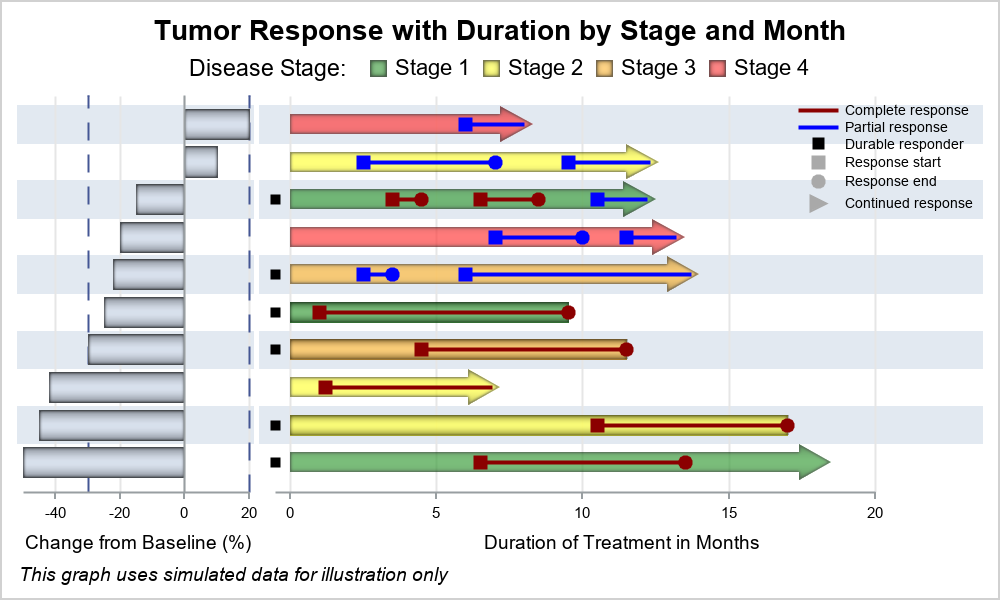
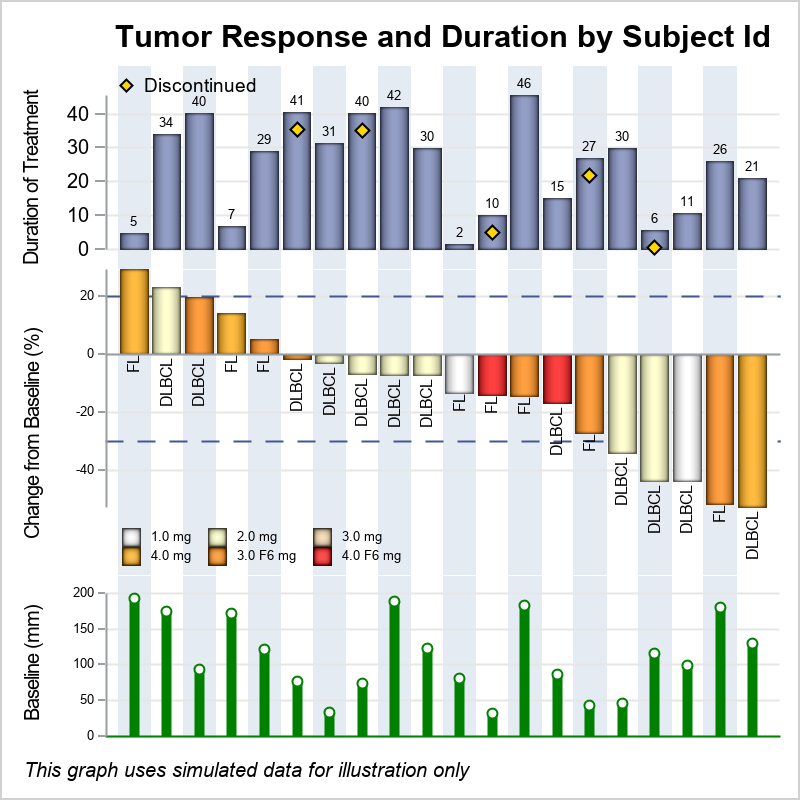
More recently, I have proposed ways to extend some standard graphs used in the analysis of Oncology data. These graphs use GTL to layout the multiple cells additional showing subject level data requested by many investigators. Here are some examples.
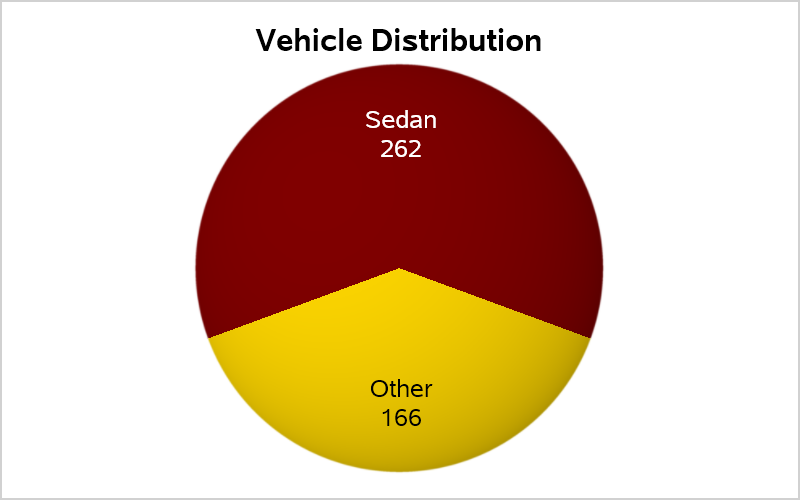
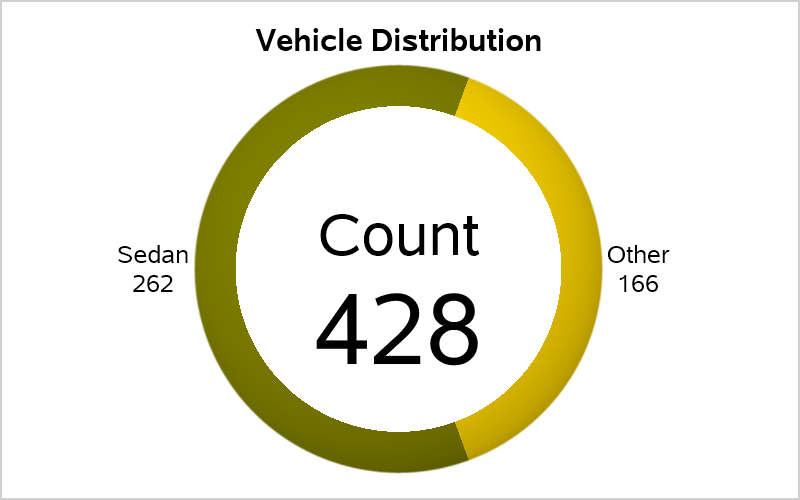
With SAS 9.4M6 we have added the SGPIE procedure to make it easier to make Pie and Donut Charts. Donut charts can be used to create simple Key Value Indicators too.

You will find articles providing the details for all the graphs shown above in this blog. Just search for a related term.
ODS Graphics has come a long way to support the needs of SAS procedure writers and SAS users. For this, I am grateful for the leadership provided by Bob Rodriguez with significant contributions from Warren Kuhfeld and SAS statisticians. The system was designed and implemented by our ace team including Dan Heath, Prashant Hebbar, Lingxiao Li, XiaoLe Xu, Dan O'Connor and David Kelley.
As I retire from SAS at the end of 2018, it is time to say goodbye. I was privileged to have the opportunity to work with this talented group of professionals, to write articles in this blog and provide presentations at many conferences and user locations about this software. I hope you have found these useful in your work. Warren Kuhfeld contributed many articles for this blog and for that we are grateful to benefit from his knowledge. Special thanks to Rick Wicklin for getting be started on blogging and his steady support and Chris Hemedinger for his support.
Going forward, I plan to continue contributing to the SAS Communities group as "Jay54", and also find a way to continue blogging on using another platform. Dan Heath and Prashant Hebbar have agreed to step up to the challenge to keep this blog going. It is in good hands. Au revoir and goodbye.


16 Comments
What a wonderful way to summarize the evolution with a visual graphical journey. Thanks Sanjay for your contributions, interactions with the community and ongoing interest as "Jay54". Happy retirement!
Thank Michelle for your support and also for retweeting many articles.
Wow, Sanjay. Where has the time gone? In some ways it seems like yesterday that we had all those weekly meetings and countless emails and phone calls. It was such a wonderful period of collaboration with incredibly bright and dedicated professionals! Your leadership along with that of Bob Rodriguez enabled us to do so much! I will always be grateful to have had you as a colleague. Have a long and wonderful retirement! Warren
Thanks Warren. It has been a great journey, and I have learned a lot from you and Bob. Wish you all the best with life after retirement. It has been a privilege to have worked with you.
Thank you good Sir; you will be missed.
Thank you, Sanjay, for your leadership, your commitment to quality, and your dedication to SAS customers. We are grateful for your hard work which led to more than 300 blog posts! Many of us learned or improved our data visualization skills by studying your well-written and easy-to-follow articles. They---and the underlying procedures and GTL---are a legacy that will serve SAS customers for many years! Best wishes in retirement!
Thank you, Rick for your kind words, all your encouragement and support both at work and for the blog. You got me started blogging and have been my "go to" resource for analytical questions. Your blog will be one way for me to stay abreast of the new exciting developments at SAS. I wish you all the best.
You, like Warren, will be definitely missed. Thank you for all your help in recent years and all the wonderful work you have shared with the SAS community. Wishing you the very best in your retirement. A well deserved opportunity to travel and visualize wonderful places without having to graph them. Looking forward to seeing Jay54 add to the community in the months and years ahead.
Thanks John. It was a pleasure and privilege to collaborate with you and all SAS users over the years.
It was a privilege to work with you Sanjay. Have a great retirement!
Thanks Susan. It was a pleasure and privilege working with you over the years to build and support great data visualization software.
I can only repeat what everyone else has said. It has been a privilege to work with you and I'll miss seeing you at conferences. It was so nice to know that I could always send my ODS Graphics questions to you. Thanks for the summary of where we have been. Where has the time gone, indeed?
Best wishes in all you do!
I will miss you , Sanjay . I learned a lot from this blog .
You will be so missed - please relish your retirement as much as you gave us methods with which to relish SAS and the SG Procedures! You have been an inspiration to me personally. Best, Louise Hadden
Than you Sanjay for all the inspiration and the untold blogs - you will be sorely missed. It has been a pleasure collaborating with you occasionally.
Perhaps Sanjay, you return to this page on occasion, or receive an alert when there's an update. I have been reading and learning from your blogs pertaining to to SGPLOT. I cannot thank you enough for your superb contributions. I began to dive into SGPLOT after your retirement, just a couple years ago - and thanks to your posts, I have learned so very much. You're like an online mentor, and I'm almost glad I wasn't "waiting for your next blog", but instead, have access to all your work now. So selfish, I know.
I have always produced graphs that turn numbers into stories, but I have evolved with your help (and the help of other stellar SAS contributors). I will continue to struggle, continue to learn, and continue to appreciate your contributions, despite the fact I never met you. Know that your work lives on. You are STILL helping us!!
Thank you!