Starting with SAS 9.4M6, procedures that used to be provided with a SAS/GRAPH installation are now available with Base SAS. Using these procedures along with PROC SGMAP can help you create some very nice maps. This blog builds on previous posts and highlights the:
- MAPSSAS Data Sets
- GREMOVE procedure
- %CENTROID autocall macro
Here is the complete code for the example that follows.
Using the MAPSSAS Data Sets
This example creates a U.S. map of the different time zones by county and uses MAPSSAS data sets, maps.counties and maps.uscenter, and sashelp.zipcode. The sashelp.zipcode data set is kept up-to-date and contains many variables including: ZIP codes, area codes, and time zones.
MAPSSAS data sets are automatically available with a SAS/GRAPH installation. If SAS/GRAPH is not installed, but Base SAS is, you can download the final; SAS 9.4 version of these MAPSSAS data sets. Go to SAS Maps and Geocoding, click the v94mapssas_all.zip link, and enter your site number to download the file.
To use the downloaded maps, set a libname and run PROC CIMPORT to create the library:
libname maps 'C:\maps\v94mapssas_all'; proc cimport infile='C:\maps\v94mapssas_all\v94mapssas_all.cpt' library=maps; run; |
Creating the Data for PROC SGMAP
This example uses three data set options for PROC SGMAP: mapdata, maprespdata (for map response data), and plotdata. The CHOROMAP statement uses mapdata and maprespdata, and the TEXT statement uses plotdata to plot labels.
Create the mapdata using maps.counties, and limit the data to the contiguous United States. Next, change the coordinates in radians to degrees latitude and longitude so that they can be used with the Esri background map. Finally, define a new variable named state_county for each county.
/* data for the choromap */ data us_counties; set maps.counties; if state in (2, 15, 72) then delete; /* Not AK, HI, PR */ x = -x * 45/atan(1); /* CONVERT FROM RADIANS TO DEGREES */ y = y * 45/atan(1); state_county = catx(' ',state,county); if x = . or y = . then delete; /* fips change for Oglala Lakota Co, SD to match MAPSSAS data */ /* New name, Oglala Lakota (46 102), old name, Shannon (46 113) */ if state_county = "46 113" then state_county = "46 102"; run; |
The maprespdata is made using sashelp.zipcode. Define the state_county variable in this data set to match the variable above and run PROC SORT with NODUPKEY so that you have only one record for each state_county.
/* Data for the map response */ data zipcode; set sashelp.zipcode; where timezone in: ('Eastern', 'Central', 'Mountain', 'Pacific'); state_county = catx(' ',state,county); run; /* Only one record for each county */ proc sort data=zipcode out=timezones nodupkey; by state_county; run; |
The plotdata option uses maps.uscenter and the FIPSSTATE function creates the state labels.
Note that the CHOROMAP statement is production-level starting with SAS 9.4M6. Here is the PROC SGMAP procedure using the data sets created in the previous step:
/* This is the beginning of the Esri URL */ %let url = http://services.arcgisonline.com/arcgis/rest/services; proc sgmap mapdata=us_counties /* US Counties */ maprespdata=timezones /* US Time Zones */ plotdata=plot_data; /* Text for State Labels */ /* Draw base map. */ esrimap url= “&url/Canvas/World_Dark_Gray_Base”; /* Draw county polygons atop base map */ /* with timezone as the response variable */ /* to show the zones separately. */ choromap timezone / mapid=state_county id=state_county density=1 name="Choro"; /* Plot state names on map */ text x=long y=lat text=statename / textattrs=(color=cyan size=10pt); /* Add legend. */ keylegend "Choro"; run; |
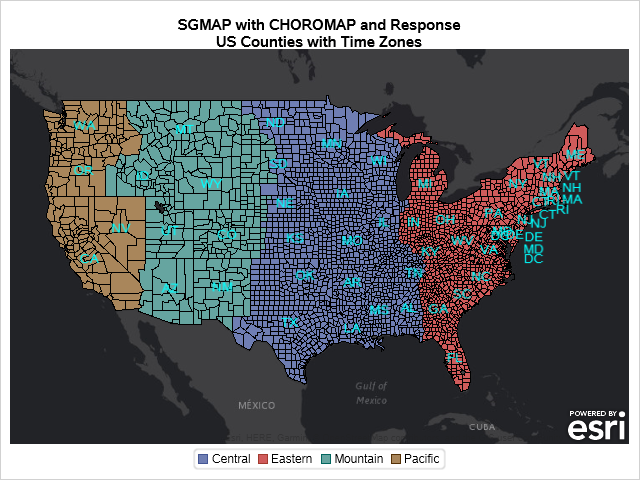
This is a step in the right direction, but the county lines provide a level of detail that is unnecessary.
Remove Unnecessary Boundaries with PROC GREMOVE
Use PROC GREMOVE to remove the inner boundaries of each time zone. Begin by sorting the data, and assign a time zone to each county by merging the counties and the time zone data sets.
/* Sort the counties data set */ proc sort data=us_counties out=us_counties; by state_county; run; /* Merge the two data sets */ data time_counties; merge timezones us_counties; by state_county; run; |
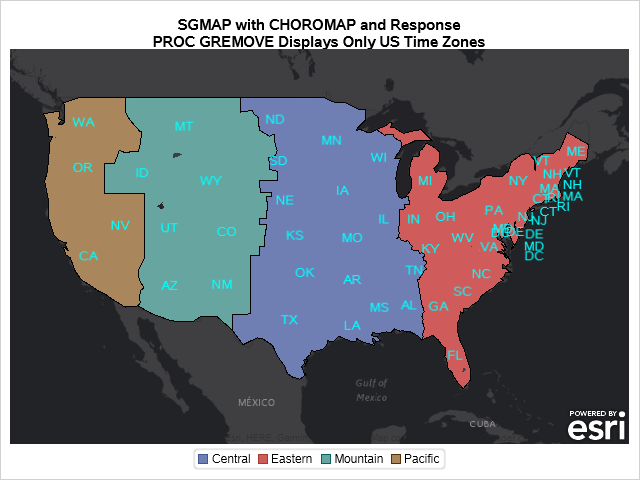
Use PROC GREMOVE to remove the extra county lines using “by timezone” and “id state_county”:
/* Sort the counties data set before running PROC GREMOVE */ proc sort data=time_counties out=time_counties; by timezone; run; /* Run PROC GREMOVE to leave only the time zone lines */ proc gremove data=time_counties out=rem_counties; by timezone; id state_county; run; |
Run PROC SGMAP using the reduced map data set for mapdata, and this output is the result:
Use the %CENTROID Macro to Position Labels
That is looking much less cluttered! But now the state labels look a little strange because the state boundaries are not drawn. It would be helpful if we could put the time zone labels on the map and center them within each time zone. The %CENTROID macro accomplishes this.
Instead of using the state labels from sashelp.zipcode, use the time zone labels that you created for each area.
/* Data for region labels */ %centroid(rem_counties, time_labels, timezone); |
Note that starting with SAS 9.4M6, it is no longer necessary to run the %ANNOMAC macro before using the %CENTROID macro.
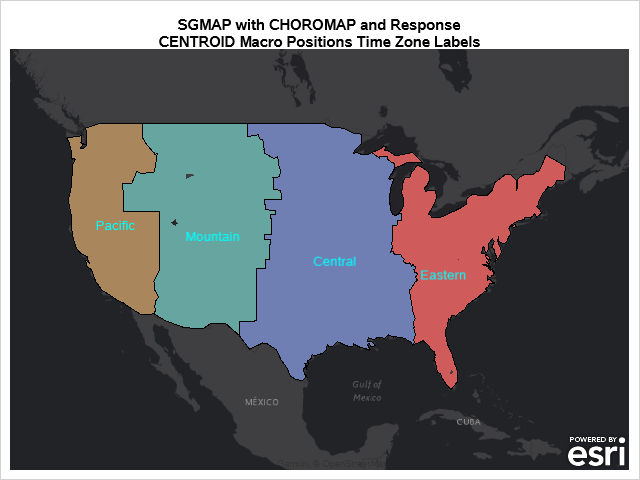
That looks good. We made a concise map that shows the different time zones in the United States.
Starting with SAS 9.4M6, the remaining SAS/GRAPH mapping preparation procedures moved to Base SAS. Use these to fully prepare map data that is useful as input to PROC SGMAP. The result is creative map output.
Here is a list of these procedures and tools:
- GEOCODE
- GINSIDE
- GPROJECT
- GREDUCE
- GREMOVE
- MAPIMPORT (for Esri shapefiles)
- IMPORT (for Comma Separated Value (CSV) files)
- %CENTROID macro