The TEXT plot was introduced with SAS 9.4M2 to facilitate placement of text strings in a graph. This replaces the MARKERCHAR feature of the SCATTER plot statement, which is still available, but it is better to use TEXT plot in most cases. The syntax is:
text x=column y=column text=column </ options>;
TEXT plot is optimized for text placement, with many features, including ColorResponse and SizeResponse. Today, I want to show you how to use the ROTATE=column (9.4M3) and POSITION=column (9.4M5) options for flexible positioning of the strings.
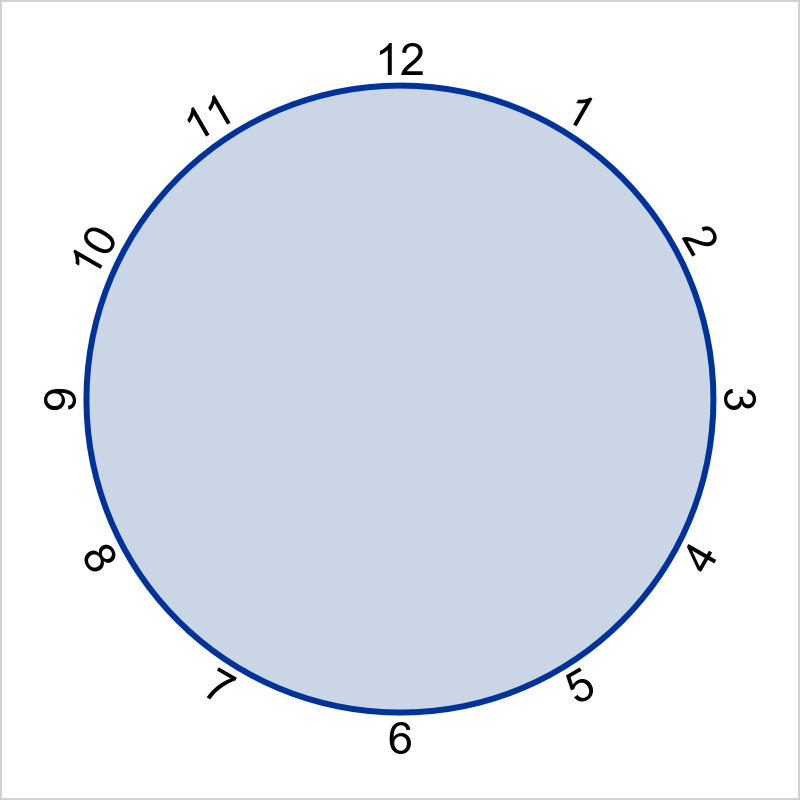
In this example, I want to draw a basic clock face, and position the numbers just outside the circle, rotated as shown. All the numbers are oriented perpendicular to the circle. I want to avoid upside down numbers so I rotated the numbers 4 - 8 in the other direction. Also, the position for the number is actually on the circle, and the text itself is displayed outside in the right direction.
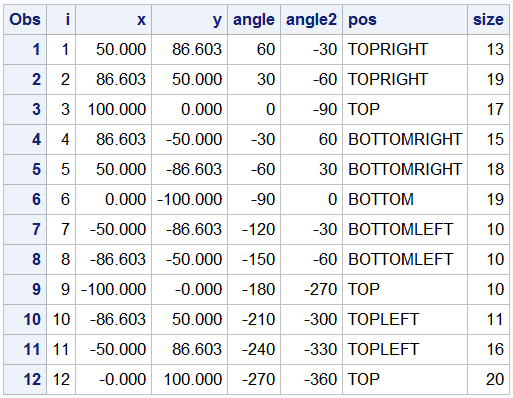
 The data for the graph is shown below.
The SGPLOT program for the graph is shown below. Note, this requires SAS 9.40M5 feature for positioning via the "Pos" column. If you have an earlier version, you could replace this by computing the position separately.
proc sgplot data=clock2 noborder aspect=1 noautolegend;
text x=x y=y text=i / rotate=angle2 position=pos textattrs=(size=14) strip;
ellipseparm semimajor=100 semiminor=100 / fill outline lineattrs=(thickness=3);
xaxis display=none min=-101 max=101;
yaxis display=none min=-101 max=101;
run;
The POSITION option takes a column containing the position value for the text string. When ROTATE is also used, the string is first rotated around its center, then the resulting bounding box of the string is placed at the position requested. STRIP option is used to remove leading blanks.
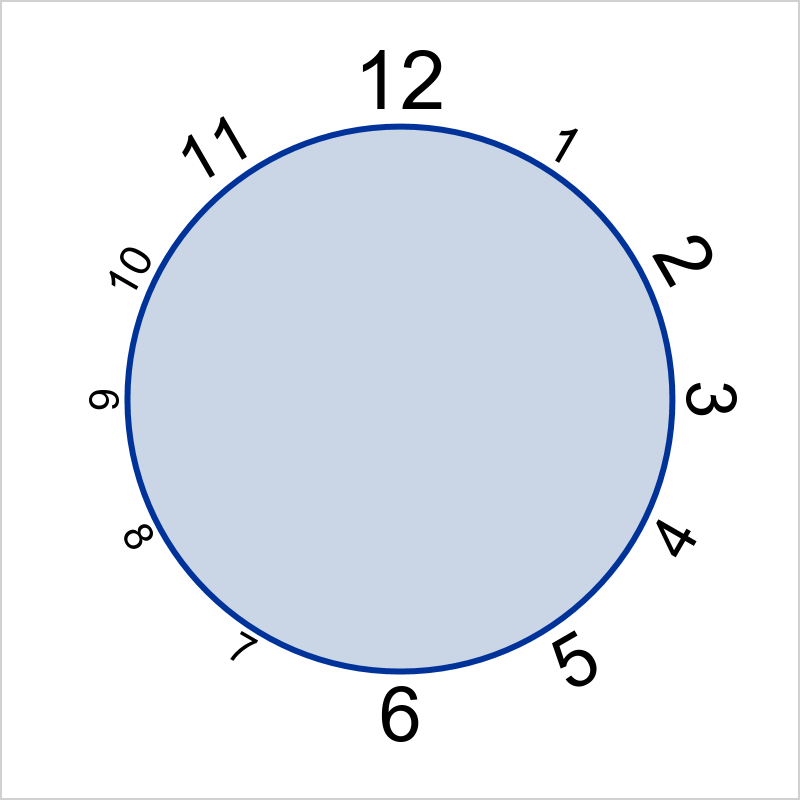
The size of each text can be scaled using the SIZERESPONSE=column option. Using the POSITION option to place the text works well as the text gets positioned using its own size (in points).
proc sgplot data=clock2 noborder aspect=1 noautolegend;
text x=x y=y text=i / rotate=angle2 textattrs=(size=14) strip position=pos
sizeresponse=size sizemin=6 sizemax=30 sizemaxresponse=20;
ellipseparm semimajor=100 semiminor=100 / fill outline lineattrs=(thickness=3);
xaxis display=none min=-101 max=101;
yaxis display=none min=-101 max=101;
run;
In the process of writing this article, two bugs were discovered. Workarounds are used in the program code. These will be fixed in a future release:
- For the TEXT plot, the position values for "3" should be "RIGHT" and for "9", it should be "LEFT". However, these did not work, and I had to put the value "TOP" for both to get the correct result.
- For the ELLIPSE plot, the plot line gets clipped at the top, bottom, left and right extremes. This happens for thick lines, and may not be apparent with 1 px thickness. This can be addressed by increasing the data area a bit like I did using the MIN and MAX options on the XAXIS and YAXIS.
Full SAS 9.4M5 SGPLOT code: Clock


2 Comments
can GTL achieve this function?
Yes.