Recently a colleague was requested to create a bar chart showing the performance of students in a school compared to county and state wide schools. The solution using SGPLOT was simple as shown below.
/*--Create data--*/
data school;
input Year Group $ Value;
format Value percent5.1;
datalines;
2010 School .
2010 County 0.45
2010 State 0.42
2011 School 0.54
2011 County 0.46
2011 State 0.44
run;
/*--Default bar labels--*/
title 'Student Performance';
proc sgplot data=school noborder;
vbarparm category=year response=value / group=group groupdisplay=cluster
displaybaseline=auto datalabel dataskin=pressed;
xaxis display=(noticks noline nolabel);
yaxis display=(noticks nolabel noline) grid;
run;
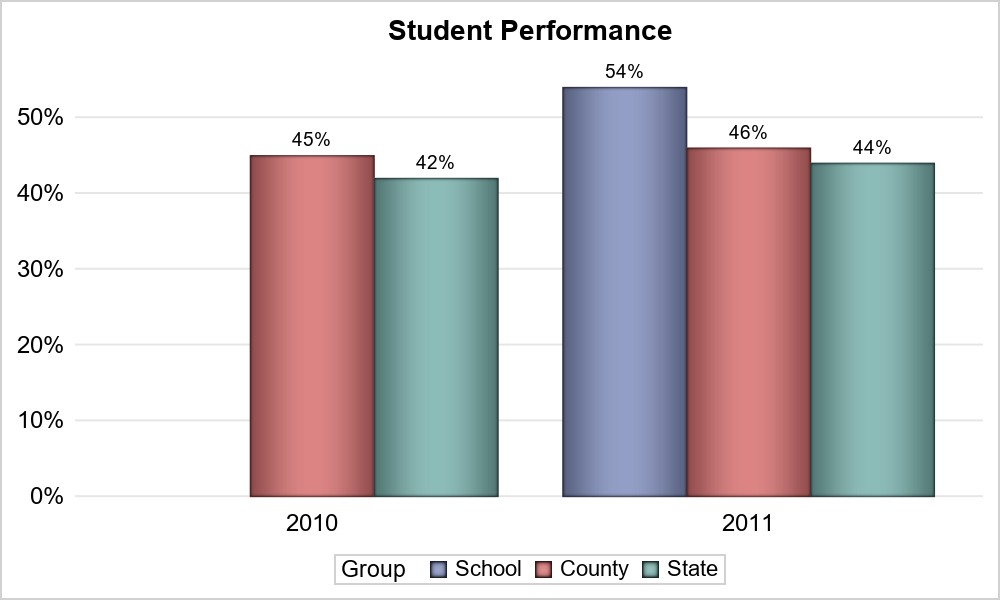
This works fine. First value is missing, so bar and label are not drawn. Note, DISPLAYBASELINE is a SAS 9.4M5 option. If you have an earlier version, you can just remove it.
It turns out the customer wanted a "N/A" to be displayed for the missing "School" value for 2010. Maybe the school only started in 2011. A solution was suggested by Dan Heath for displaying "N/A" for the missing value using the DATALABEL=column option. Create another column that contains the text strings for the values using a put statement and replace the missing value by "N/A".
/*--Create new columns Label and Value2--*/
data school2;
set school;
format Value2 percent5.1;
length label $6;
label=ifc(value, put(value, percent5.1), "N/A");
Value2=ifn(value, value, 0);
run;
/*--Custom bar labels--*/
title 'Student Performance';
proc sgplot data=school2 noborder;
vbarparm category=year response=value2 / group=group groupdisplay=cluster
displaybaseline=auto datalabel=label nozerobars dataskin=pressed;
xaxis display=(noticks noline nolabel);
yaxis display=(noticks nolabel noline) grid;
run;
However, this will not work using RESPONSE=Value. When a value is missing, the entire bar is not drawn, including any data labels (even from a different column). So, we need to create another column "Value2" where missing is replaced by a "zero". Then, we can use RESPONSE=Value2 DATALABEL=Label and NOZEROBARS option to get the desired results.
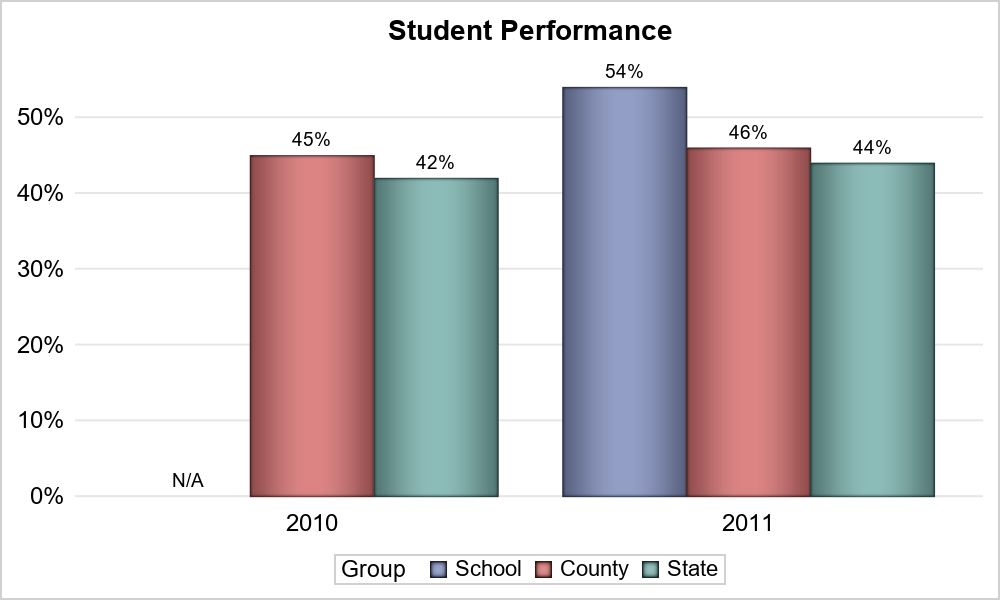
Now, if you want the "N/A" to be displayed with a larger font or different color, you can use a TEXT plot overlay from another column where only the "N/A" string is present and all other observations are blank. Then, you can set different font attributes for the TEXT plot.
SGPLOT Code: Custom_Bar_Labels
