A customer asks in SAS Communities if SG annotation works with BY groups. In other words, if you put a BY variable in your DATA= data set and a matching BY variable in your SGANNO= data set, will you get the BY-group specific annotations for each graph? Well, no; it is not quite that simple. However, you can get separate annotations if you add some post-processing.
The question was asked in the context of PROC TEMPLATE and PROC SGRENDER. Steve England from SAS posted an answer--one that had not occurred to me. Steve's answer was adapted from an example in the GTL documentation. It showed how to make the BY variable and the SG annotation ID variable the same to get the expected annotations. This post will show you how to take Steve's idea along with some of my ideas about how to make highly customized graphs and apply SG annotations to different BY groups in PROC SGPLOT.
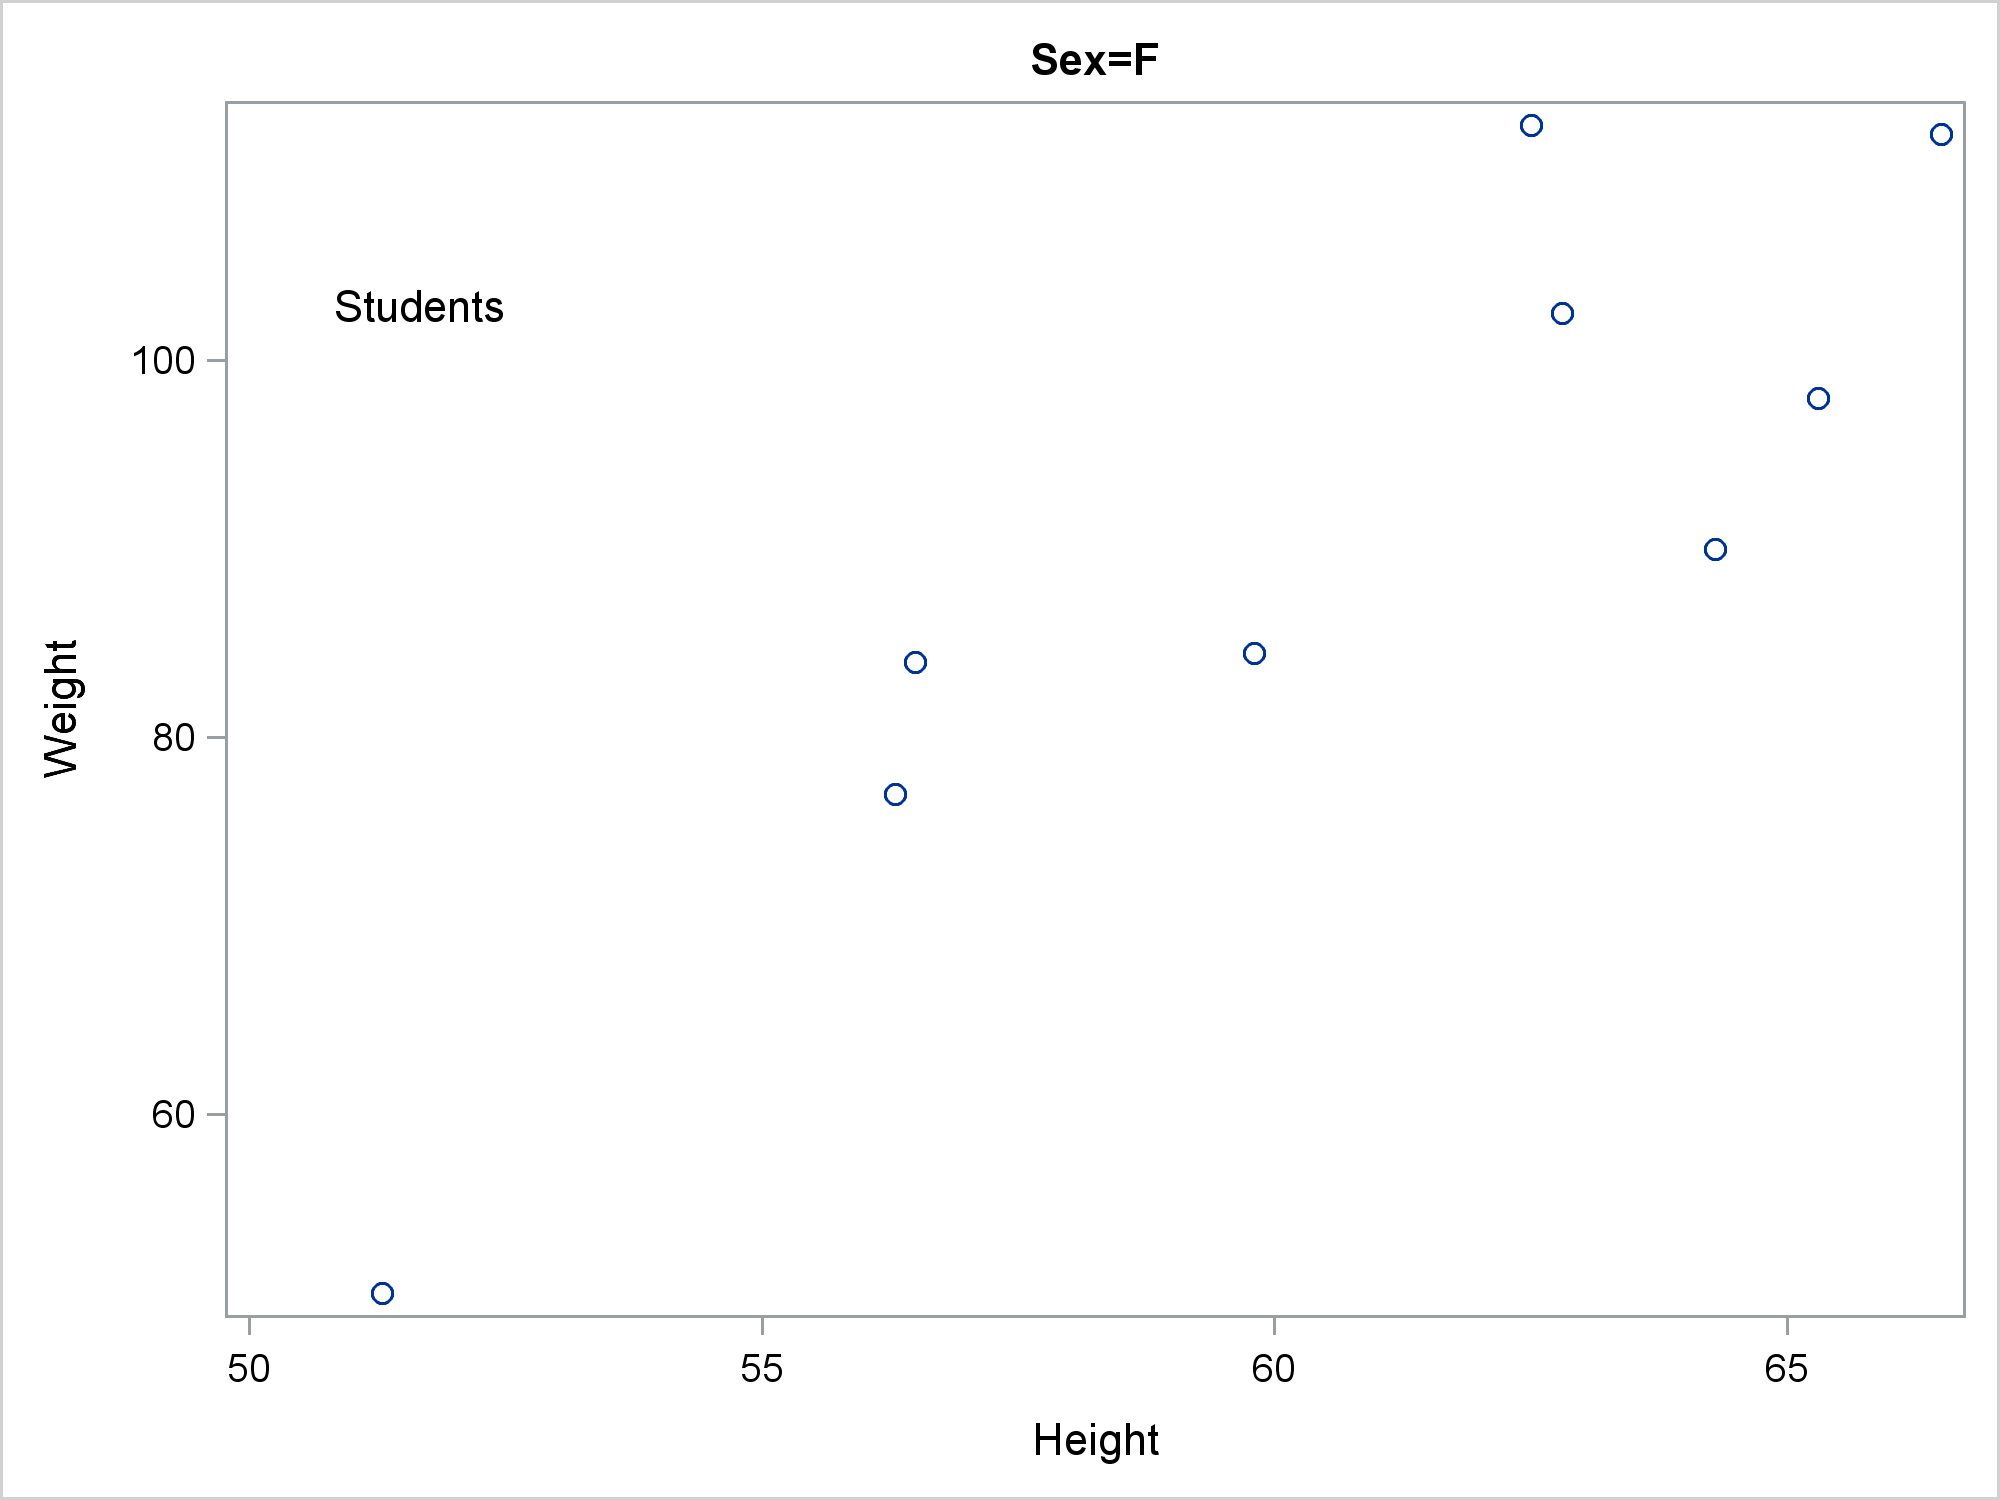
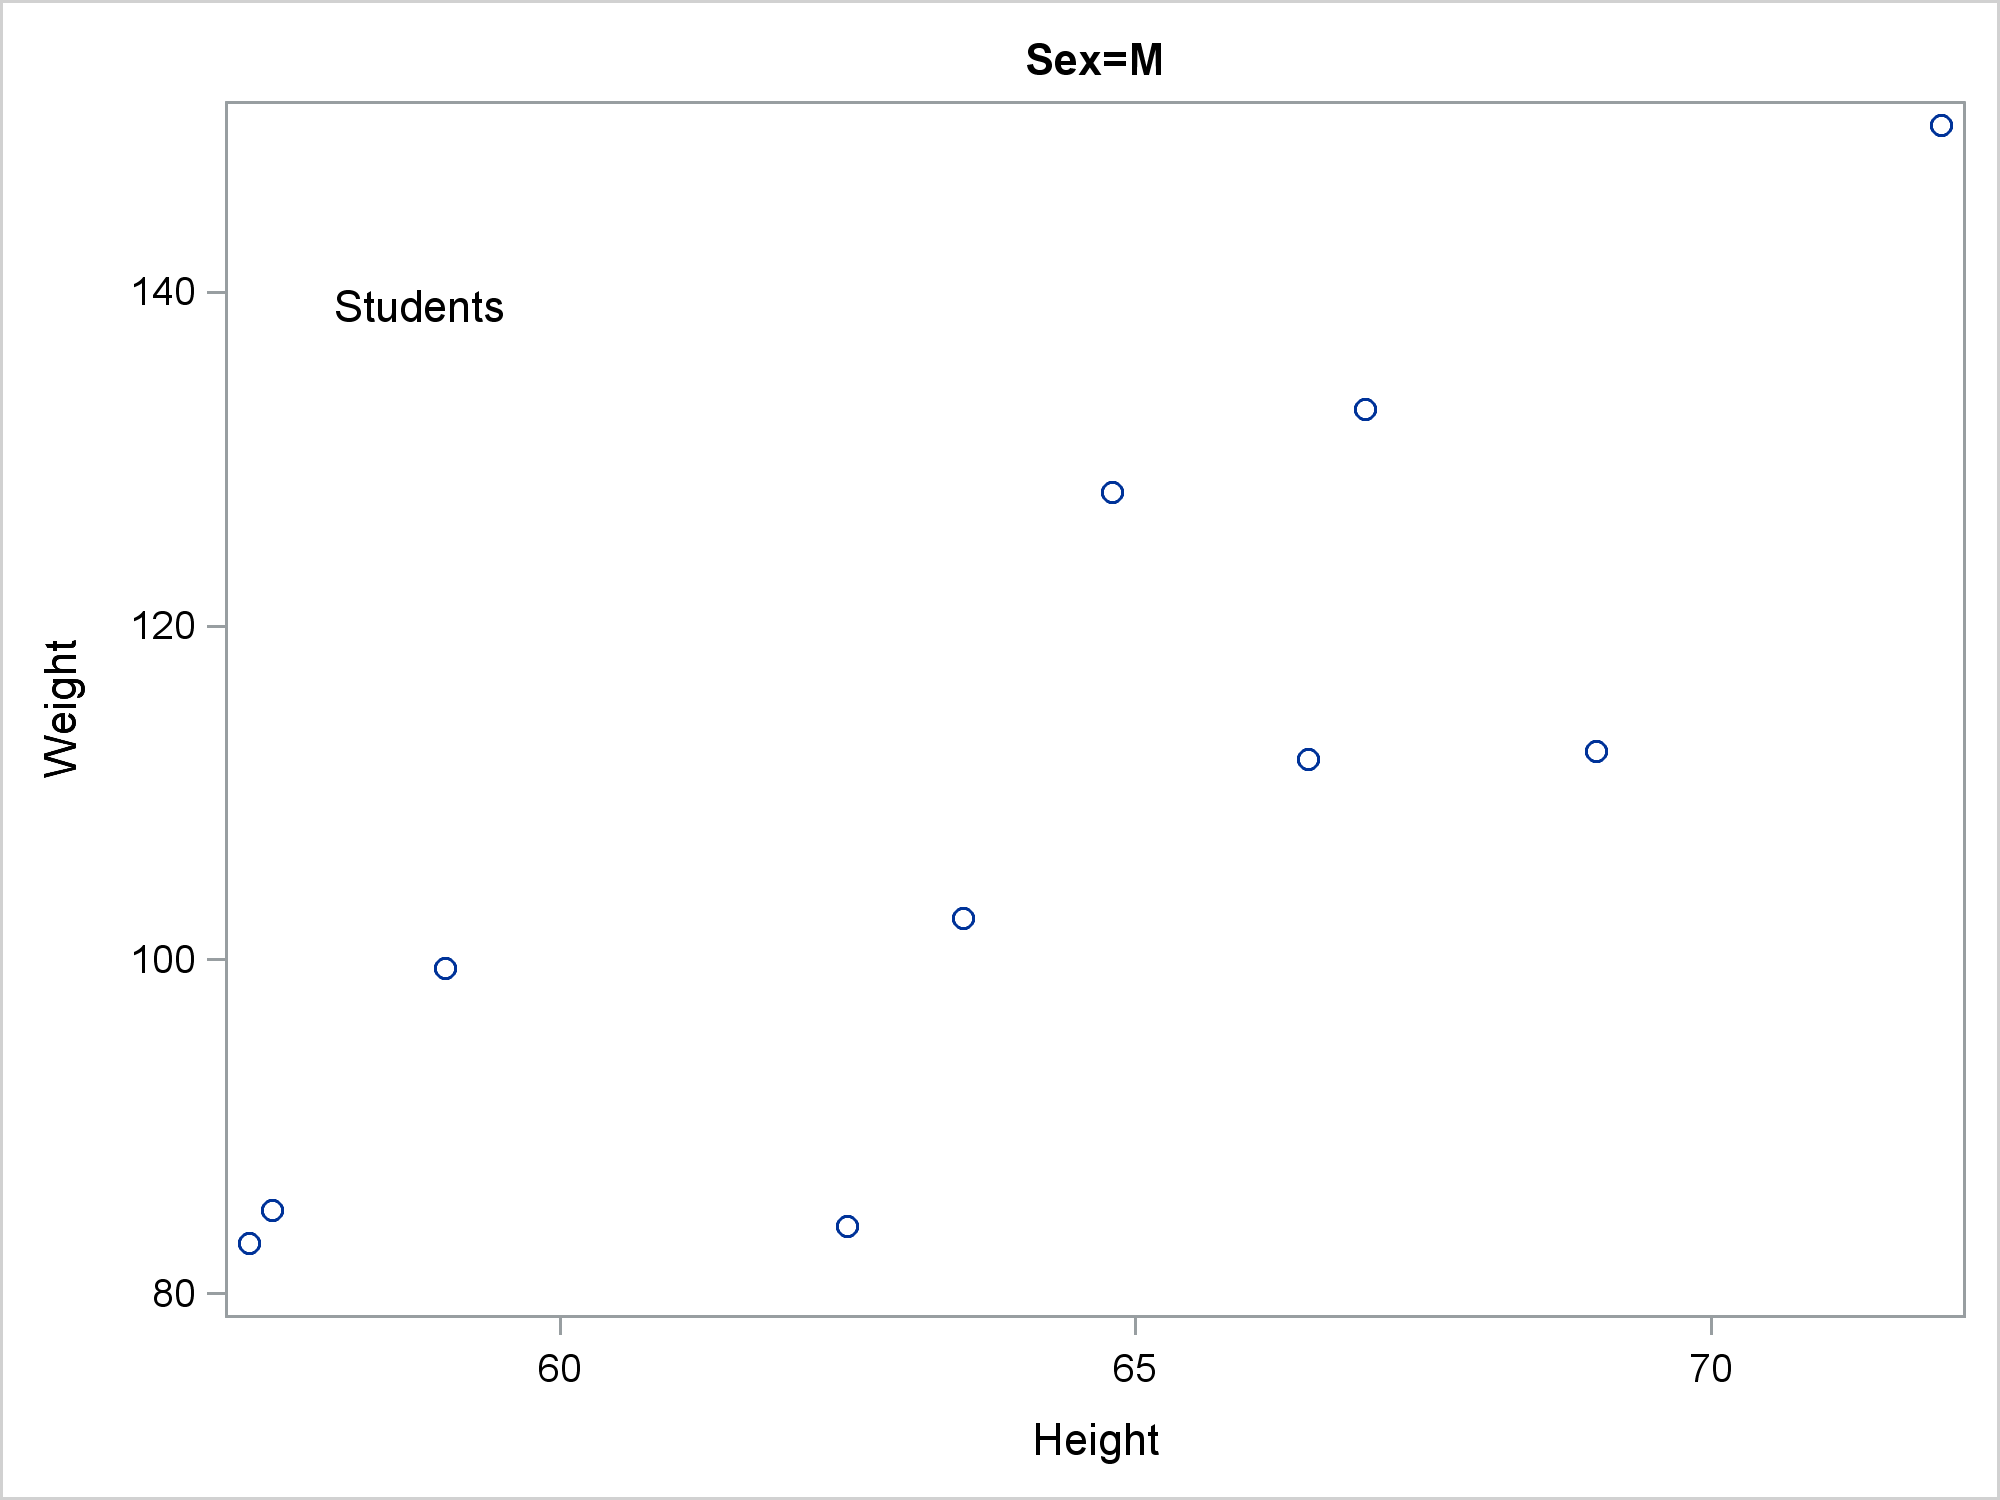
Before we get to that, let's get a better idea of what happens when you run PROC SGPLOT along with a BY statement and an SG annotation data set. This example adds an annotation, the word "Students" to each of the graphs that are produced by running PROC SGPLOT by Sex.
proc sort data=sashelp.class out=c; by sex; run; data anno1; retain x1 20 y1 85 function 'Text' dataspace 'GraphPercent' width 100; label = 'Students'; output; run; proc sgplot data=c sganno=anno1 tmplout='tmp1.tmp'; scatter y=weight x=height; by sex; run; |
The TMPLOUT= option is not required. However, it shows the template that PROC SGPLOT writes that gets used to make the graph. If you really want to understand what PROC SGPLOT does, you need to understand the template. It is stored in the file tmp1.tmp, which is shown next (after adding indentation).
proc template;
   define statgraph sgplot;
      dynamic __BYLINE__;
      begingraph / collation=binary;
         EntryTitle __BYLINE__ / textattrs=(size=GraphLabelText:fontsize);
         layout overlay / yaxisopts=(labelFitPolicy=Split)
                          y2axisopts=(labelFitPolicy=Split);
            ScatterPlot X=Height Y=Weight / subpixel=off primary=true
                       LegendLabel="Weight" NAME="SCATTER";
            DrawText  "Students" / X=20 Y=85 WIDTH=100;
         endlayout;
      endgraph;
   end;
run; |
For our purposes, all I want to point out is the DRAWTEXT statement. It provides the annotation. While PROC SGRENDER accepts an SGANNO= data set, that is not how this graph is created. Instead, PROC SGPLOT reads the SG annotation data set and converts each line into a GTL DRAW statement.
Now consider an SG annotation data set that has a BY variable that matches the BY variable in the DATA= data set.
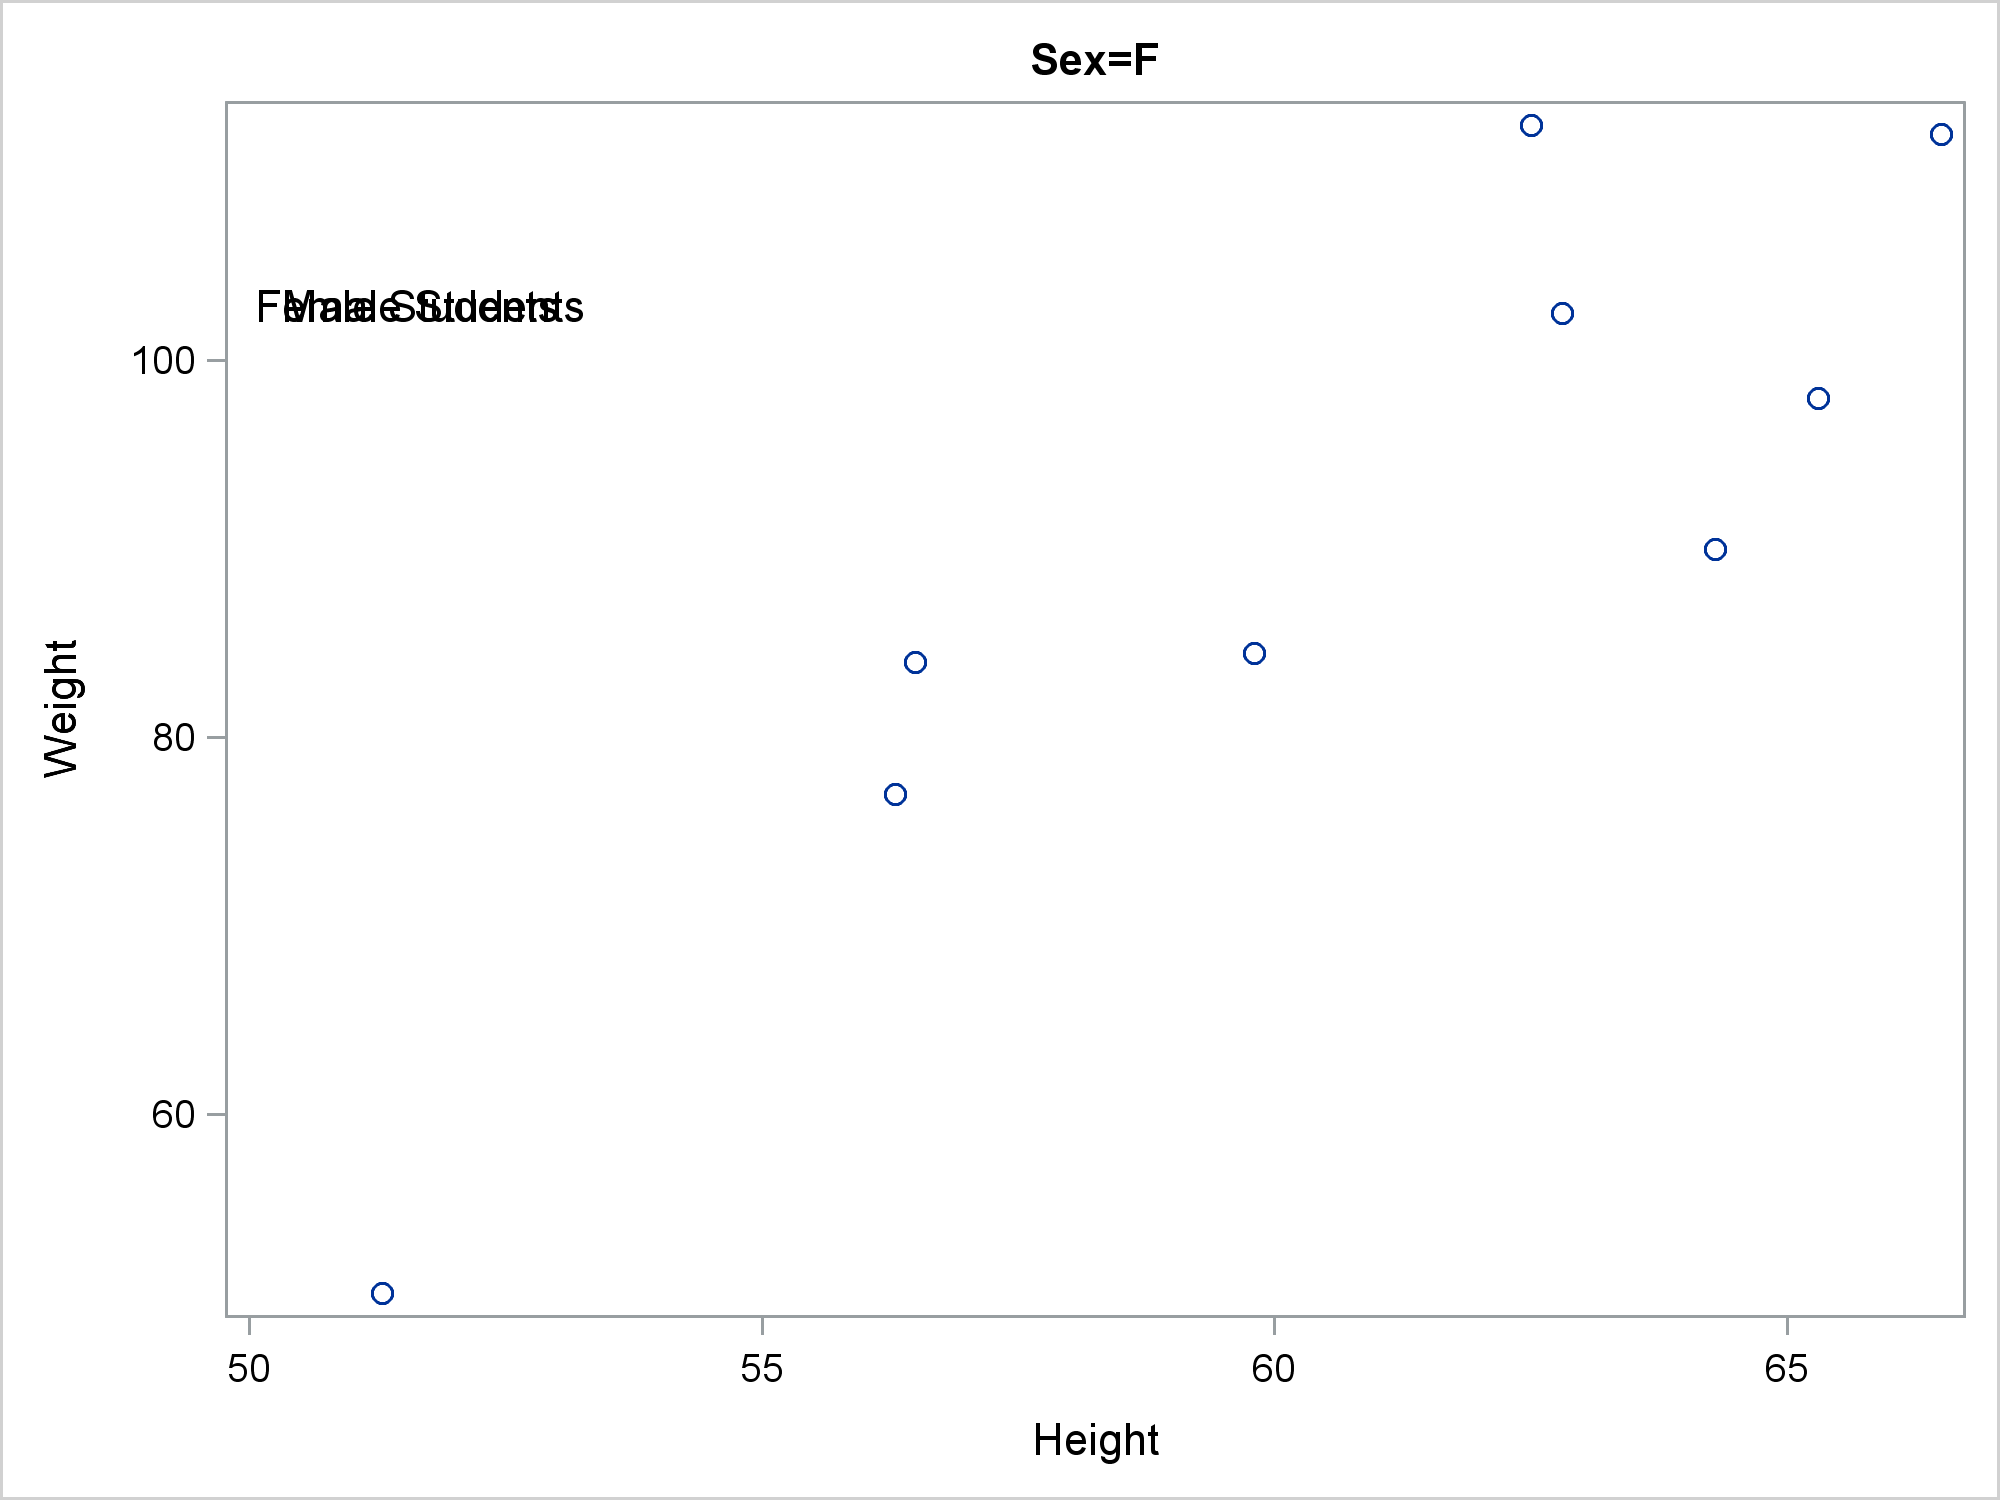
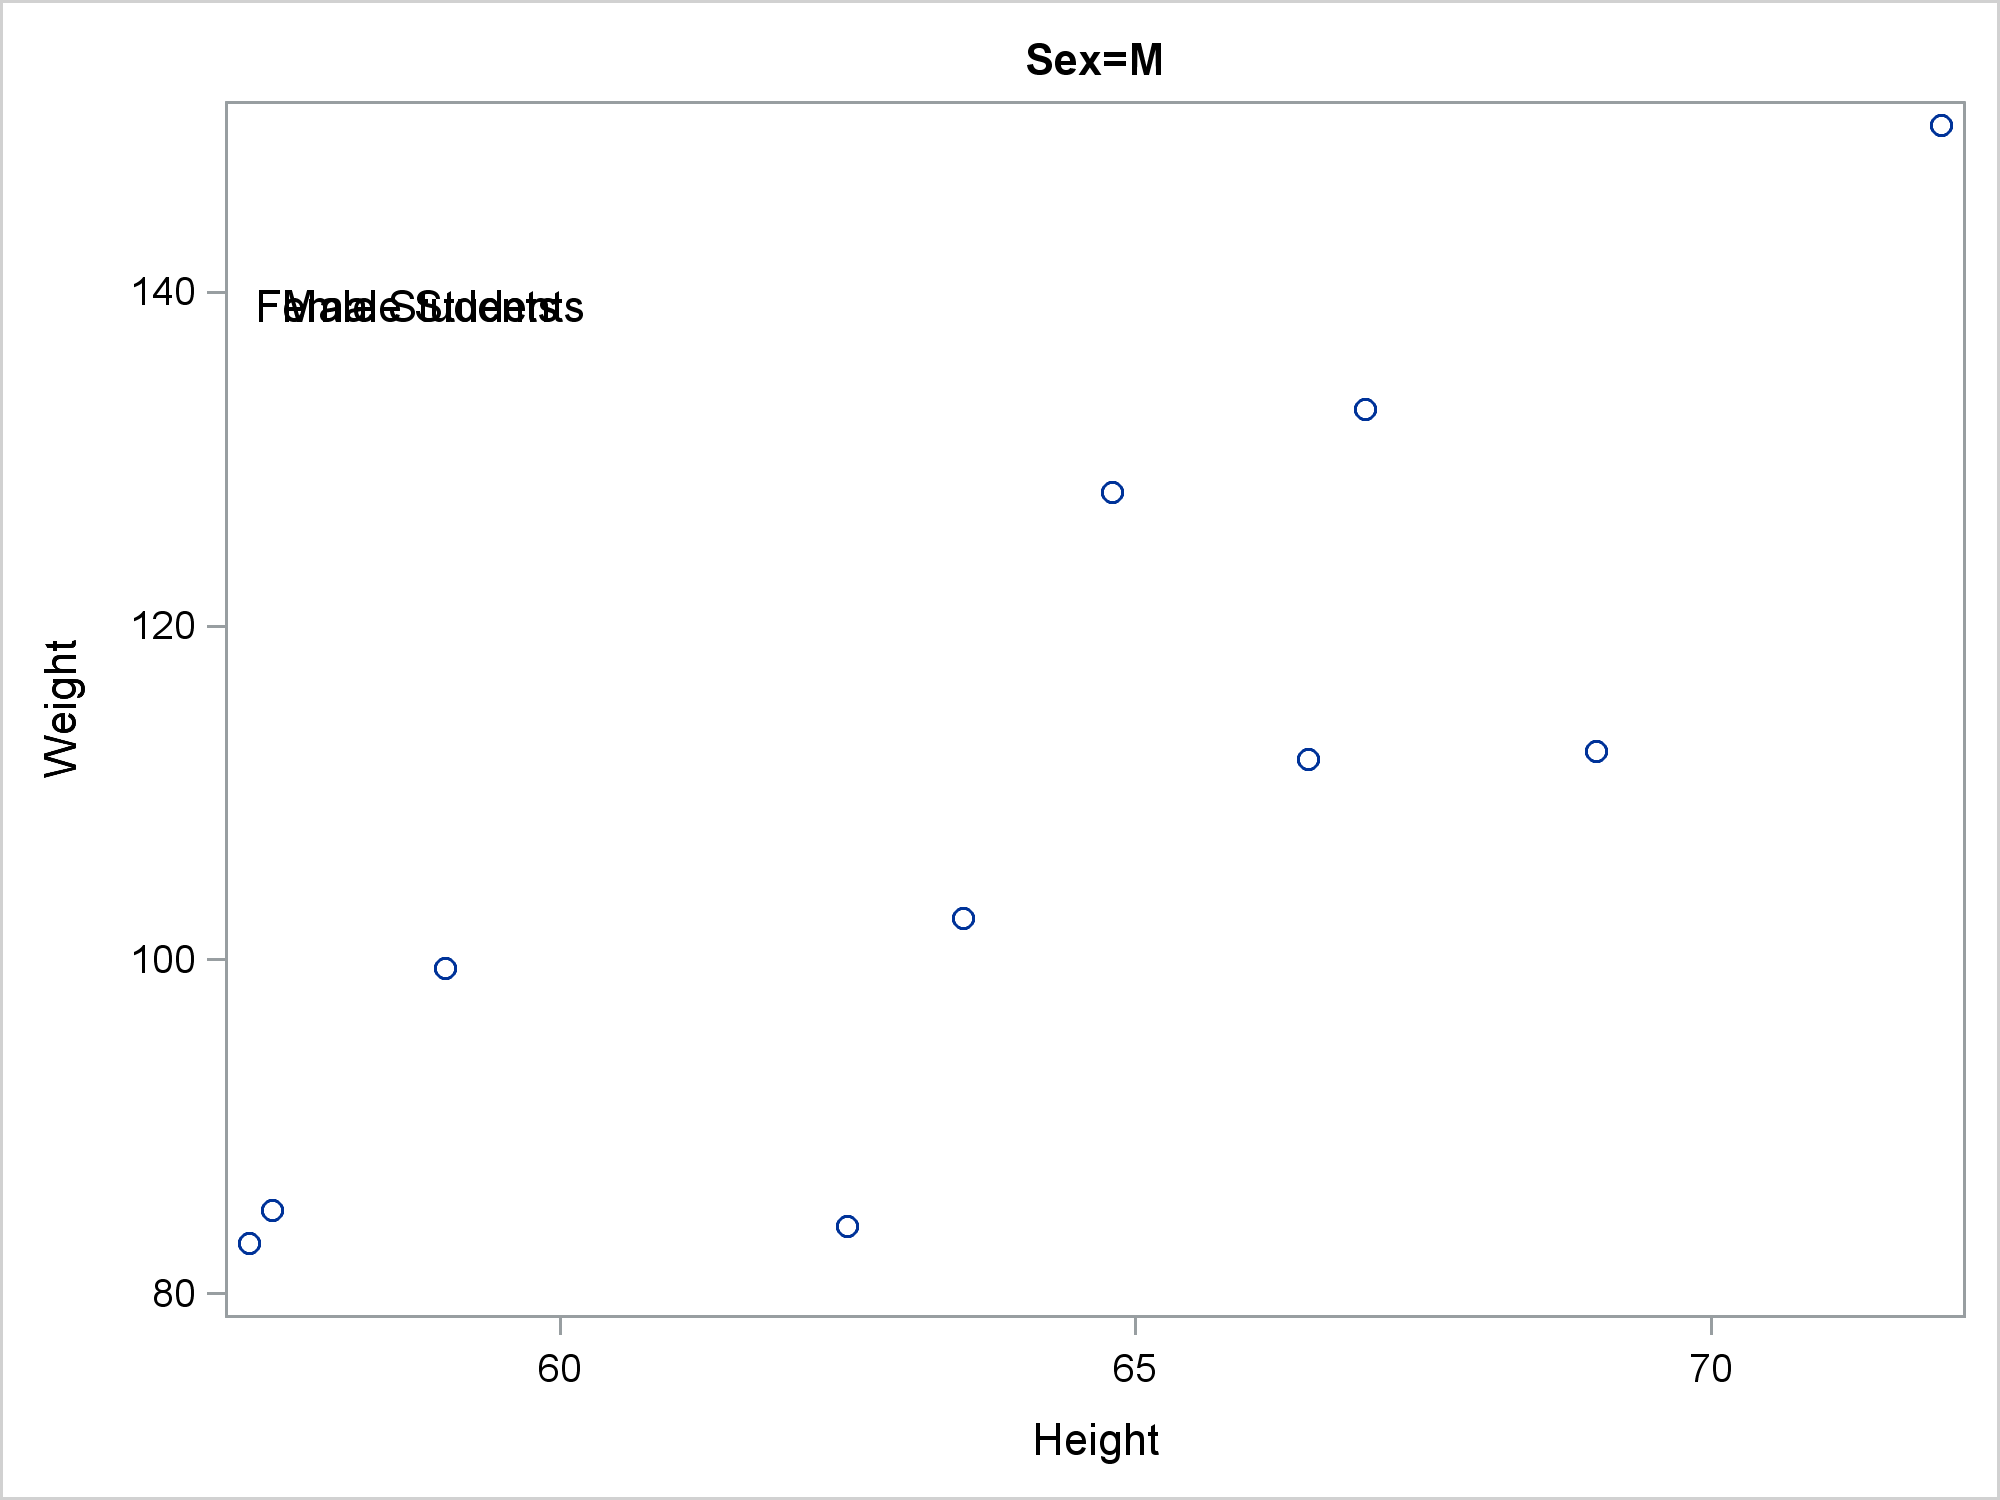
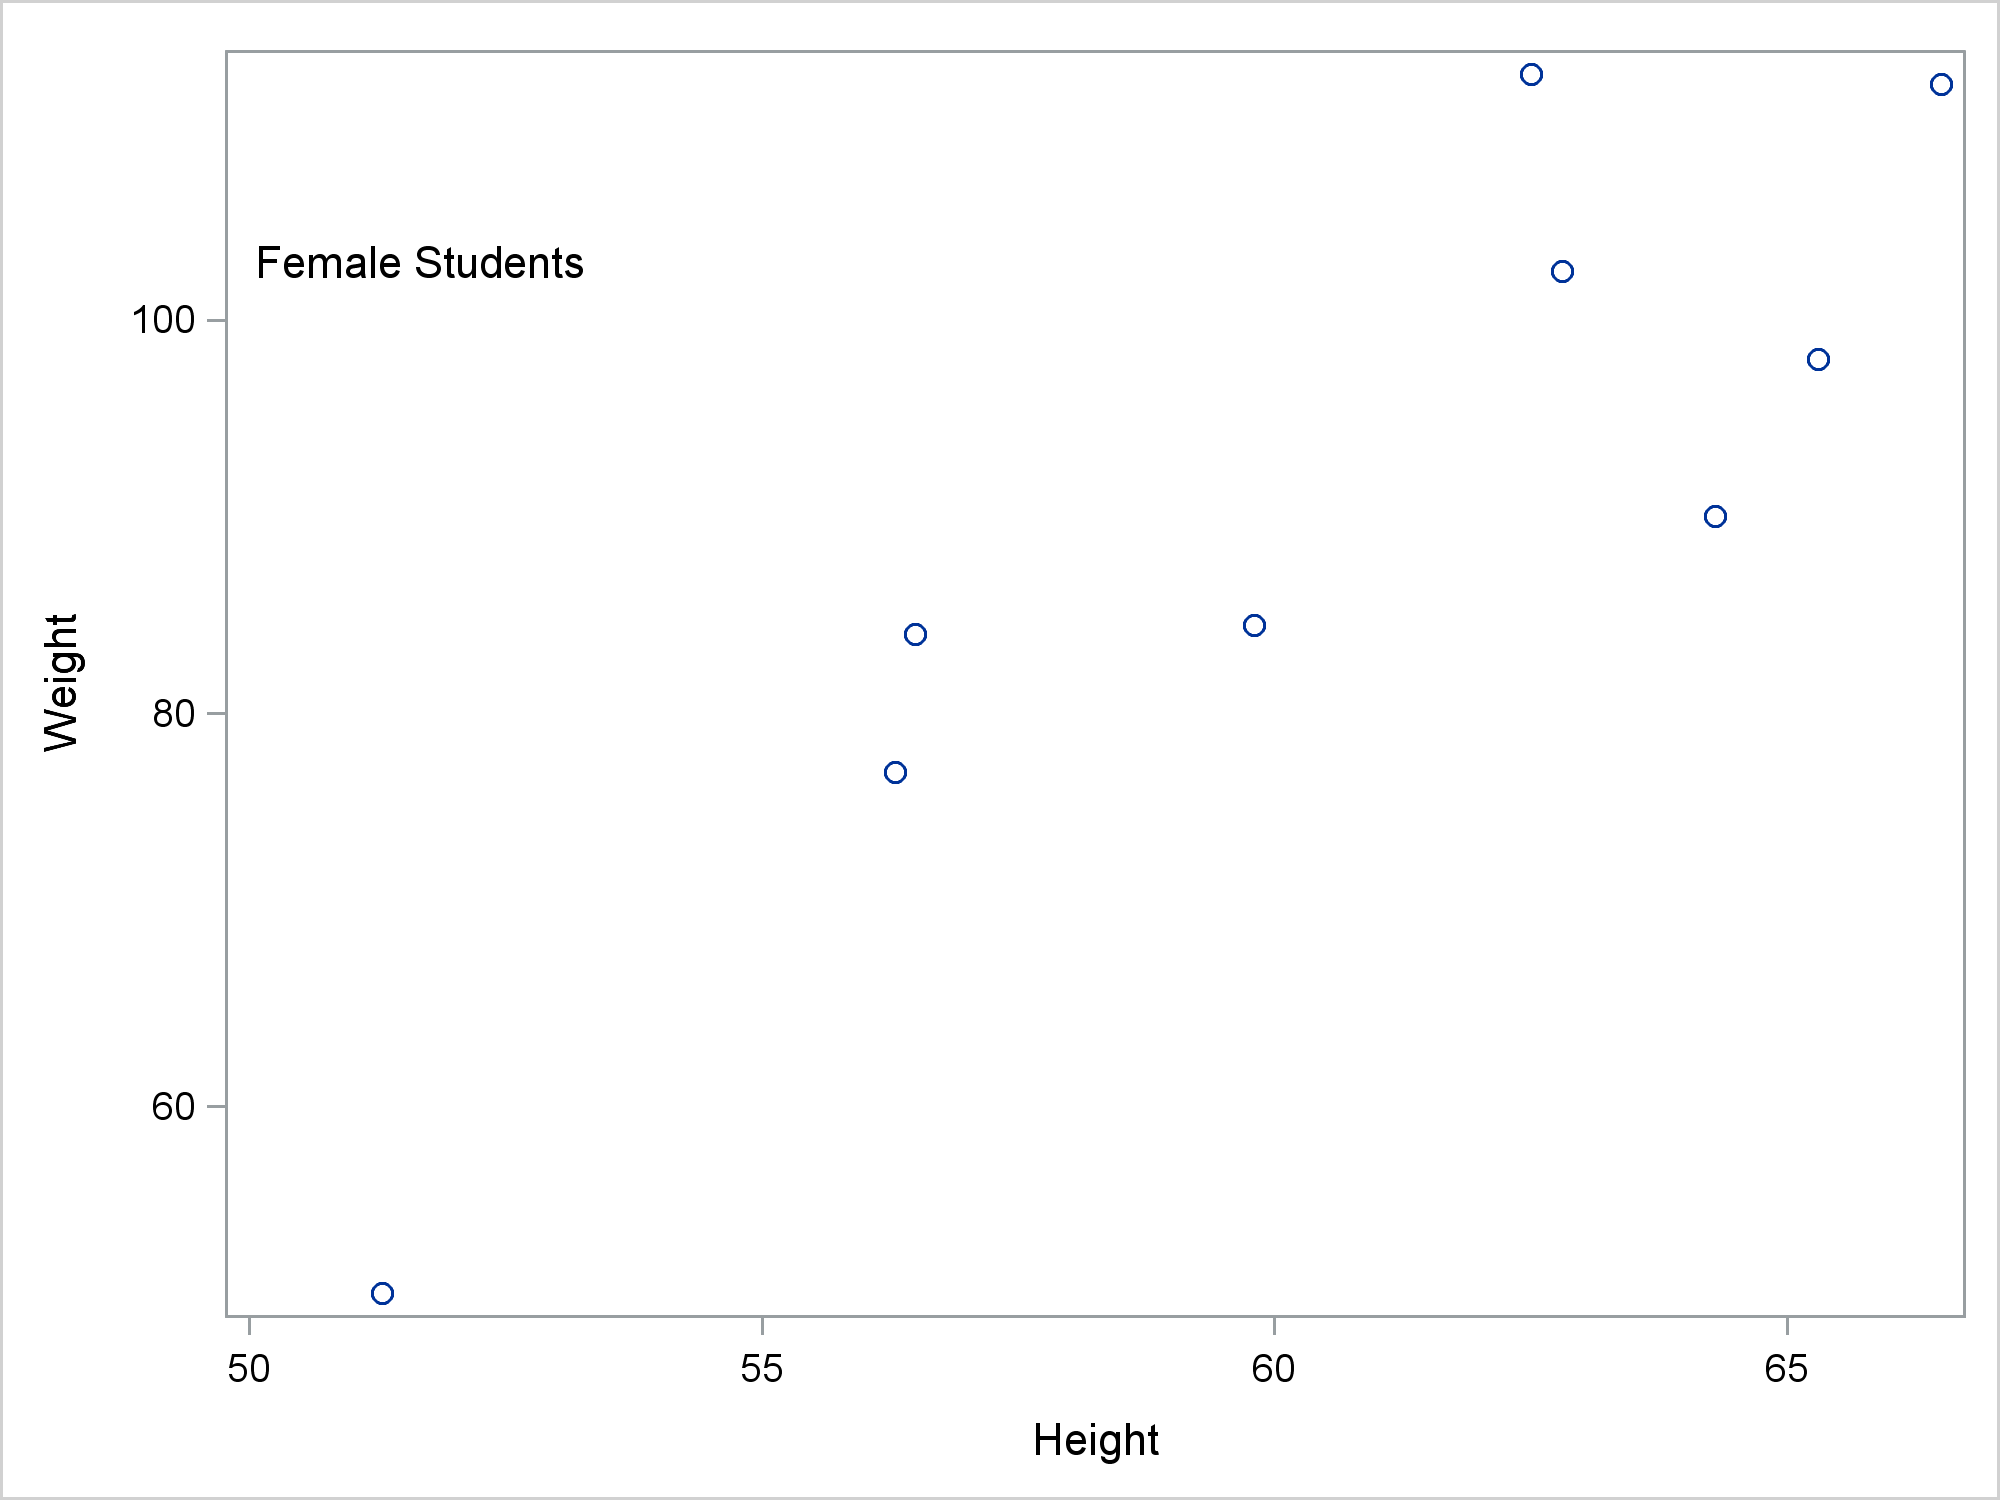
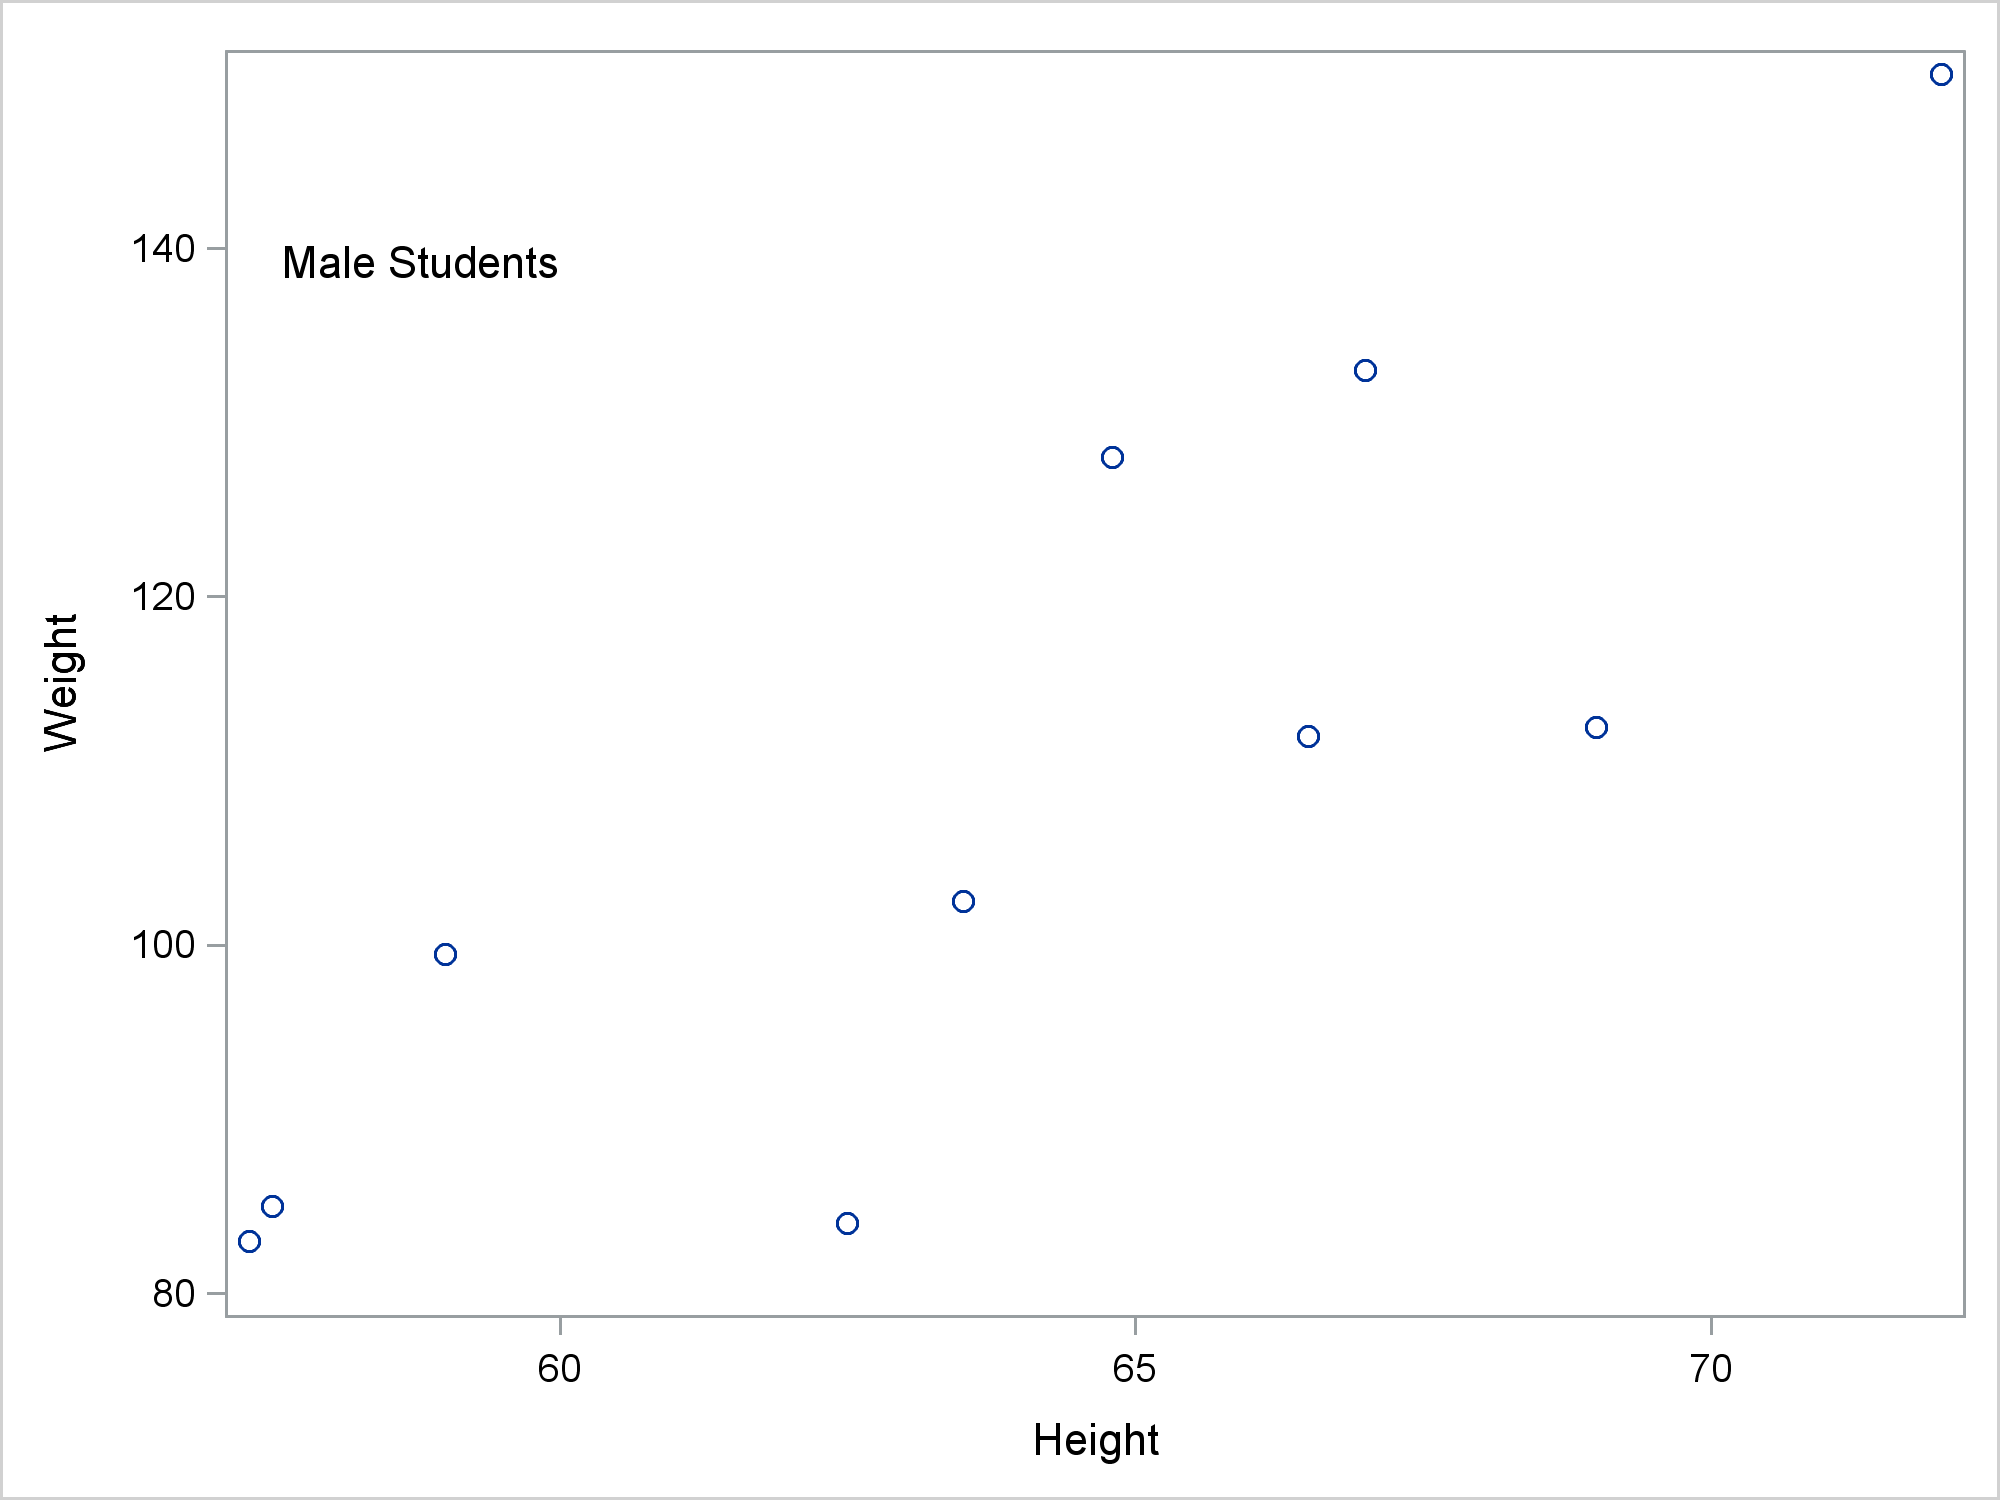
data anno2; x1 = 20; y1 = 85; function = 'Text'; dataspace = 'GraphPercent'; width = 100; label = 'Female Students'; Sex = 'F'; output; label = 'Male Students'; Sex = 'M'; output; run; |
If you run PROC SGPLOT with a BY statement and an SGANNO= option you get both annotations on top of each other in both graphs, which is almost certainly not what you want.
proc sgplot data=c sganno=anno2 tmplout='tmp2.tmp'; scatter y=weight x=height; by sex; run; |
Here is the file tmp2.tmp, which contains the generated GTL:
proc template;
   define statgraph sgplot;
      dynamic __BYLINE__;
      begingraph / collation=binary;
         EntryTitle __BYLINE__ / textattrs=(size=GraphLabelText:fontsize);
         layout overlay / yaxisopts=(labelFitPolicy=Split)
                          y2axisopts=(labelFitPolicy=Split);
            ScatterPlot X=Height Y=Weight / subpixel=off primary=true
                        LegendLabel="Weight" NAME="SCATTER";
            DrawText  "Female Students" / X=20 Y=85 WIDTH=100;
            DrawText  "Male Students" / X=20 Y=85 WIDTH=100;
         endlayout;
      endgraph;
   end;
run; |
Now there are two DRAWTEXT statements. Both are unconditionally used. So if we want different annotations in each graph, we have to approach this question in some other way. SG annotation is not required if you want to add different text to each graph. You can modify the input data set and use a TEXT statement in PROC SGPLOT.
data c2;
   set c;
   by sex;
   if first.sex and sex eq 'F' then do;
      x1 = 51;   y1 = 104; Label = 'Female';
      end;
   else if first.sex and sex eq 'M' then do;
      x1 = 56;   y1 = 140; Label = 'Male';
      end;
   else call missing(label,x1,y1);
run;

proc sgplot data=c2;
   scatter y=weight x=height;
   text y=y1 x=x1 text=label;
   by sex;
run; |


There is a lot you can do using this approach along with TEXT and POLYGON statements without ever needing SG annotation. Still, SG annotation is quite useful, and unlike the TEXT and POLYGON statements, it gives you a variety of coordinate systems.
Next, we will create an SG annotation data set along with an ID variable (named ID) whose values match the BY variable, Sex.
data anno3; x1 = 20; y1 = 85; function = 'Text'; dataspace = 'GraphPercent'; width = 100; label = 'Female Students'; id = 'F'; output; label = 'Male Students'; id = 'M'; output; run; |
Now, PROC SGPLOT is only used to write the template to a file, tmp3.tmp.
proc sgplot data=c tmplout='tmp3.tmp'; ods exclude sgplot; scatter y=weight x=height; by sex; run; |
Here is the file (without adding any indentation).
proc template; define statgraph sgplot; dynamic __BYLINE__; begingraph / collation=binary; EntryTitle __BYLINE__ / textattrs=(size=GraphLabelText:fontsize); layout overlay / yaxisopts=(labelFitPolicy=Split) y2axisopts=(labelFitPolicy=Split); ScatterPlot X=Height Y=Weight / subpixel=off primary=true LegendLabel="Weight" NAME="SCATTER"; endlayout; endgraph; end; run; |
You can use a DATA step to edit this template and submit it to SAS. The statements below change the template name from sgplot to by and add a dynamic variable and an ANNOTATE statement.
data _null_;
   infile 'tmp3.tmp';
   input;
   _infile_ = tranwrd(_infile_, 'sgplot;', 'by;');
   call execute(_infile_);
   if find(_infile_, 'layout overlay') then
      call execute('dynamic _byval_; annotate / id=_byval_;');
run; |
You can submit the following statements to view the edited template.
proc template; source by; quit; |
The compiled template is displayed next.
define statgraph By;
   dynamic __BYLINE__ _byval_;
   begingraph / collation=binary;
      EntryTitle __BYLINE__ / textattrs=(size=GraphLabelText:fontsize);
      layout overlay / yaxisopts=(labelFitPolicy=Split) y2axisopts=(
         labelFitPolicy=Split);
         annotate / id=_BYVAL_;
         ScatterPlot X=HEIGHT Y=WEIGHT / subpixel=off primary=true LegendLabel=
            "Weight" NAME="SCATTER";
      endlayout;
   endgraph;
end; |
Notice that the compiled template does not precisely match the raw template. In particular, the DYNAMIC statements are combined. One nice thing about viewing the template by using PROC TEMPLATE, is the template is nicely indented.
Notice the dynamic variable, _byval_, matches the ID= value.
Now you can use PROC SGRENDER along with the SGANNO= option and the BY statement to get separate annotations for each graph.
title; options nobyline; proc sgrender data=c template=by sganno=anno3; by sex; run; options byline; |
The alternative approach requires you to write a graph template by using the GTL and then using PROC SGRENDER. While this PROC SGPLOT approach has more steps, it is easier. It is easier to specify how to construct a graph in PROC SGPLOT than it is by writing a template from scratch. You will need a DATA step to modify that template, but it is not hard since you can simply copy my code. There is nothing that is specific to this example in the DATA step that modifies the template.
PROC SGPLOT was designed to add the same annotations to each graph. While you cannot directly get separate annotations for each BY group with PROC SGPLOT because of the way it constructs templates, it is not hard to do some post-processing to obtain separate annotations. For more examples of highly-customized graphs and using CALL EXECUTE to modify templates, see my free book Advanced ODS Graphics Examples or my PharmaSUG paper Annotating Graphs from Analytical Procedures. Also, my colleague Rick Wicklin of the DO Loop Blog provides a gentle introduction to the topic. The incredible power of template modification enables you to customize graphs in many creative ways.

3 Comments
Hi Warren how do I specify the groups (I am plotting means and error bars) by dash line versus plain line?
The default ODS style for HTML is HTMLBlue. In this style, the ATTRPRIORITY is set to COLOR, which means that the color list will be exhausted before moving to the next line pattern of marker symbol. You can override this on the ODS GRAPHICS statement by specifying ATTRPRIORITY=NONE:
ods graphics / attrpriority=color;
Help this helps!
Dan
Hi Warren
I've been searching for ages for a solution like this, and I've (almost) find it, thank you so much! just one thing; how would you do this if, instead of sex, you had a variable that can change dynamically.
I've followed your example but the issue is when I create tmp2.tmp, I cannot enter a fixed values for DrawText, as they can change.
(also I'd like to put the annotation at the bottom of the chart; I guess I should amend the template)
ps: this is my post in the SAS Communities
https://communities.sas.com/t5/Graphics-Programming/Proc-sgplot-by-add-a-table-beneath-each-chart/m-p/675919#M20372
many thanks