A while back a user requested to create a 3D WaterFall chart as presented by E Castanon Alvarez et. al. in "3D waterfall plots: a better graphical representation of tumor response in oncology" Annals of Oncology, Volume 28, Issue 3, 1 March 2017, Pages 454–456. I posted a blog article titled "A 3D WaterFall Chart" a few weeks back on a way to create such a 3D graph using SGPLOT procedure. At that time I did not publish the macro hoping to redirect the user to the alternative 2D visual, and because the macro needed some more details. At the risk of repetition, I will state my preference for the alternative 2D visual shown below.
The macro accepts a data set with 3D data for Tumor Respones and Duration, built a 3D view, transformed it into 2D space using an Orthographics projection, and then used the SGPLOT procedure to display the result. A perspective projection could also be used. The task is non-trivial, and the Macro alluded to in previous article did not cover all the aspects of the referenced graph above.
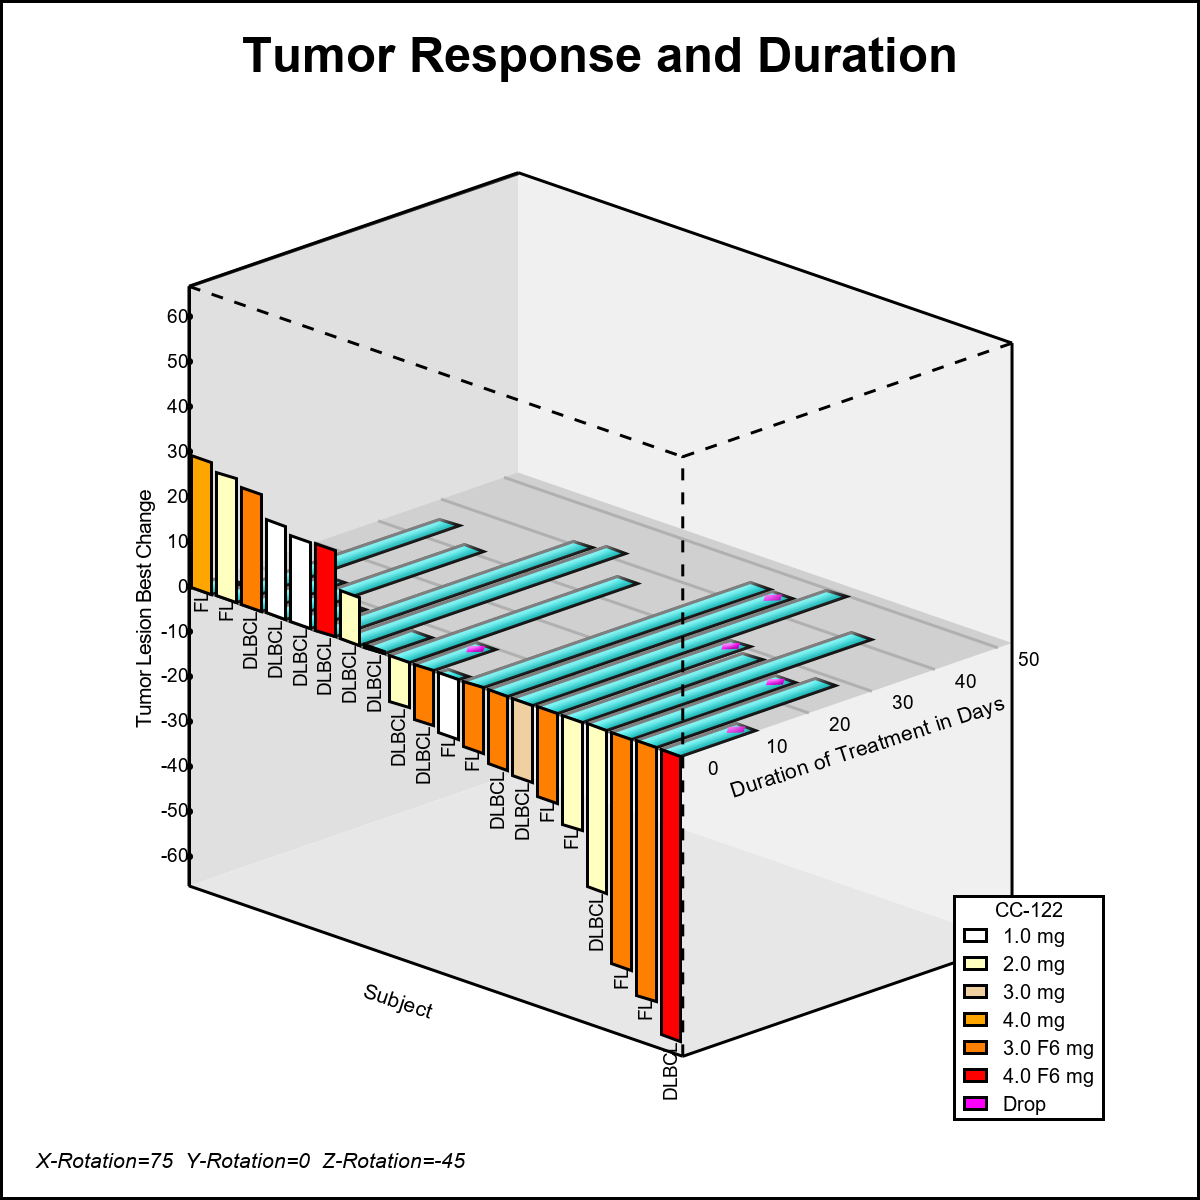
Recently at SGF 2018, I heard additional requests for such 3D graphs. Often, these requests are motivated by the proposed 3D graph in the paper that was built using R. Users want to know why we cannot build a similar graph using SAS. To address such questions, I decided to add in the missing features to the macro such as the color by Treatment, axis tick values, and additional overlays and publish the code. Here is the resulting graph. The full macro code is provided in the link at the bottom.
The API for the macro call is shown below, with one of the results.
ods graphics / reset attrpriority=color width=4in height=4in imagename="Waterfall_150";
%WaterFall_3D_Macro (Data=tumor, Duration=duration, Response=response, Dropped=dropped,
Group=Drug, Code=Code, AttrMap=attrmap, Lblx=Subject,
Lbly=Duration of Treatment in Days, Lblz=Tumor Lesion Best Change,
xFac=1.5, Tilt=75, Rotate=-45, Title=Tumor Response and Duration);
Parameters:
%macro WaterFall_3D_Macro (
Data=, /*--Required - Data set name--*/
Duration=, /*--Required - Treatment Duration NUMERIC variable--*/
Response=, /*--Required - Tumor Response NUMERIC variable--*/
Dropped=, /*--Required - Subjects dropped NUMERIC variable--*/
Group=, /*--Required - Treatment Drug NUMERIC variable with format--*/
Code=, /*--Required - RECIST Code CHARACTER variable--*/
AttrMap=, /*--Required - Attribute Map Data Set--*/
Lblx=X, /*--X-Axis (Front) Label--*/
Lbly=Y, /*--Y-Axis (Horizontal plane) Label--*/
Lblz=Z, /*--Z-Axis (Vertical) Label--*/
xFac=1, /*--X-Axis scale factor NUMERIC--*/
Tilt=65, /*--View Tilt 60 to 80--*/
Rotate=-55, /*--View Rotation -15 to -75--*/
Title= /*--Graph Title--*/
);
Disclaimer:
As a matter of policy, SAS R&D is not able to provide programming services or consulting services for SAS customers. However, there are times when a coding example can be of general use to customers and we can justify writing an example to demonstrate the type of method or logic needed. This program is for demonstration purpose only, and may work ONLY for the combination of variables and data provided. We cannot directly write a customer program nor can we support or maintain the example program. If there are further data changes or requirements it will be up to you to make the necessary changes to the program to best fit your data.
This program is not tested for bad or missing data or wrong type of variables. The user is advised to add the code to the macro to check for existence of the variables in the data set and the correct type.
In the above 3D graph, the data is really 2D with only one independent variable - the SubjectId. The tumor response is displayed in the vertical face, and the duration of the treatment along the horizontal plane for the same subject. Some markers are displayed on the duration bars. Code values are displayed at the bottom on the x-axis.
Displaying this 2D data in a 3D view presents some challenges:
- It is harder to compare the bars when drawn in 3D view.
- The original graph used a perspective view, making comparisons harder.
- Some duration bars are hidden behind the tumor change bars.
- The markers on the duration bars are not clearly visible.
- The codes at the bottom on the x-axis are hard to read.
- The codes at the bottom are hard to line up with the bars.
- The 3D view program has hundreds of lines of code.
Here is a 2D alternative that shows all the data shown above in a simple 2D view.
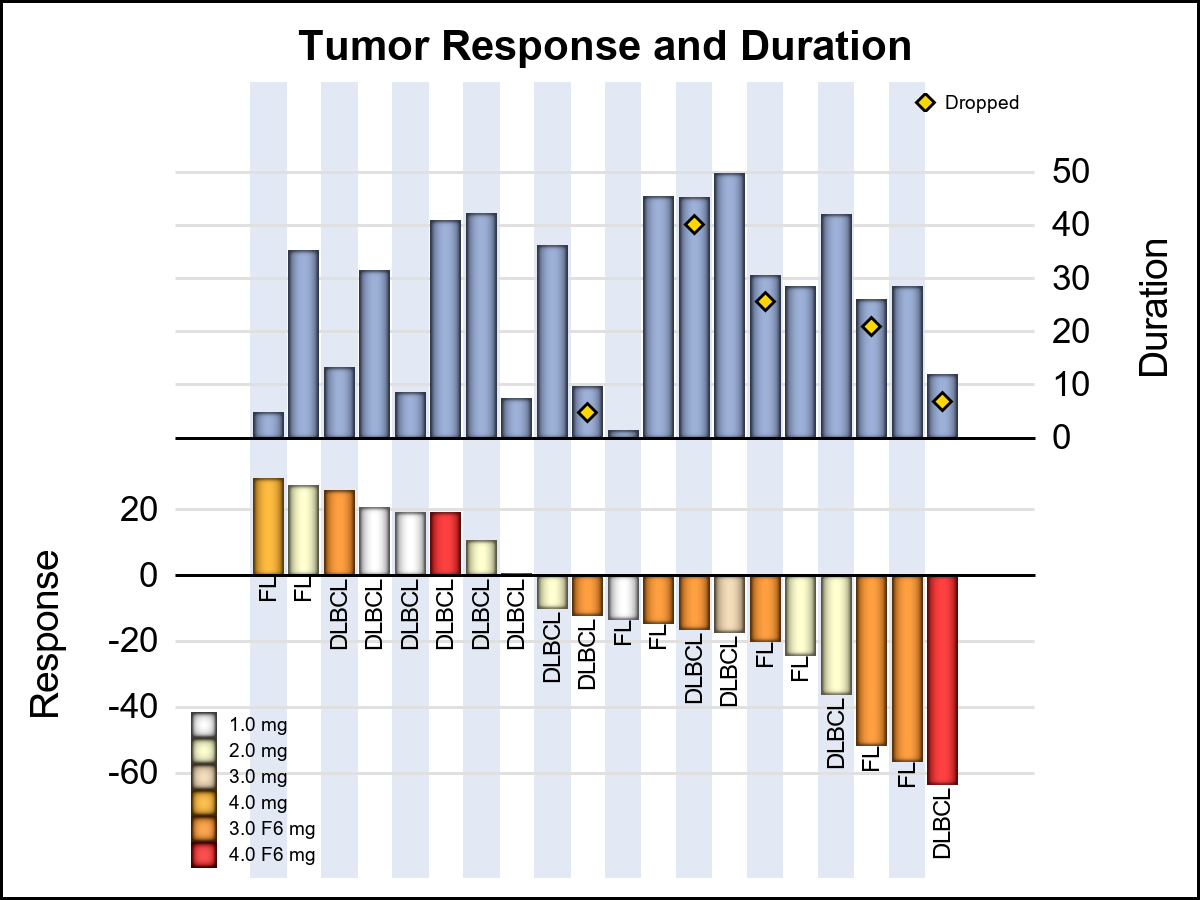
This graph can be created using < 10 lines of SGPLOT code. Additional information can be easily added in this view.
Files: Matrix_Functions, WaterFall_3D_Macro, WaterFall_3D, WaterFall_2D
Run the programs in the order above. The Macro program does not check for variables existence or type. Please feel free to improve and change this as you wish. Please note the disclaimer above. I look forward to reader comments.


2 Comments
Hi Sanjay, I fully agree that the 2d Version is much better. I've stolen most of this for other types of work. On the topic of 3d why is there no way to plot scatter Points in 3d in the Statistical Graphics procedures or templates. Working With Oil reservoirs we have to create 3d contour or lattice visualizattions. The lack of being able to pinpoint some features with scatter Points is restricting use. I have done this a long time ago with the G3d procedure, but it was really hoorible.
Thanks forall the good ideas in Your blog.
Hi Pal. Thanks for your comment. We have always regretted we did not add the 3D scatter plot to the GTL back when we added the other two 3D statements. If we get an opportunity, we will do that. I have put out a macro that can plot a 3D scatter by itself. Maybe that can be helpful as a work around.