This article is motivated by a recent question on the SAS Communities board. This user wants to create a series or spline plot where the attributes of the line (color, thickness) can be changed based on another variable. In this case it may be a binary variable with "0" and "1", but this could be any number of discrete values.
So, my guess is that the user wants something like this. A single series plot where the visual attributes can be varied along the length of the series based on another variable. In this case, I changed the line color and the thickness. This is clear from the legend.
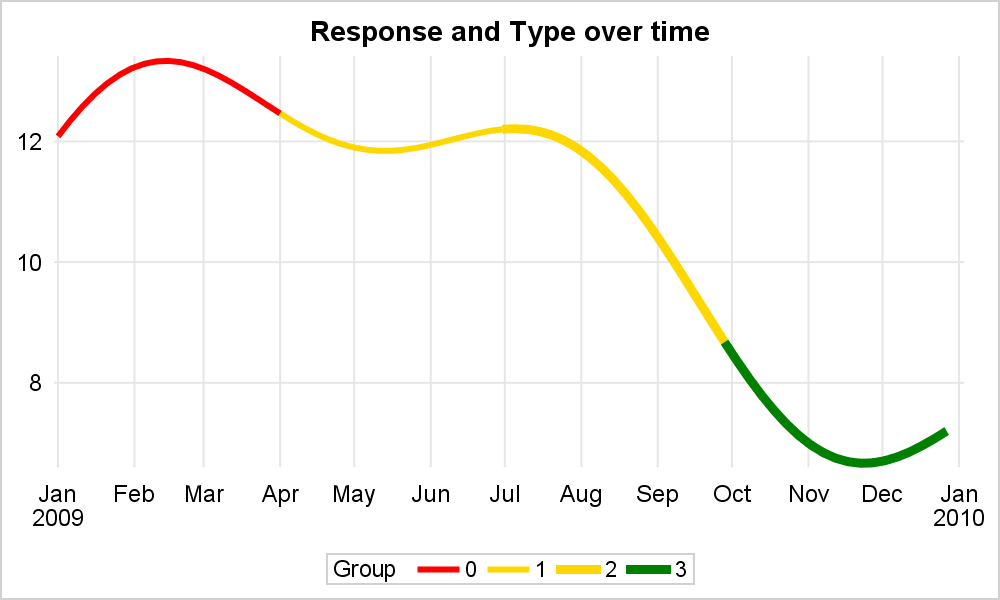
So, how can we create such a graph using SGPLOT? A single series plot can have a fixed color, pattern or thickness for the entire series. For a grouped series plot, the observations with the same group values are joined to form the series. Each group gets different attributes. So, in this case, I have assigned different group values to different segments of the series. To retain the continuity of the entire curve, the last point in the previous group must be replicated as the first point in the next group.
Then, I created a Discrete Attributes Map to set the color and thickness for each group. Here is the code. See the linked code at the bottom for the full program.
/*--Define Attr Map for group values using FORMATTED data--*/
data discreteMap;
length value LineColor $8;
Id='X'; Value="0"; LineColor='red'; LineThickness=3; output;
Id='X'; Value="1"; LineColor='gold'; LineThickness=3; output;
Id='X'; Value="2"; LineColor='gold'; LineThickness=5; output;
Id='X'; Value="3"; LineColor='green'; LineThickness=5; output;
run;
/*--Series with varying attributes by group--*/
title 'Response and Type by Date';
proc sgplot data=series noborder dattrmap=discreteMap subpixel;
series x=date y=a / group=group attrid=X;
xaxis display=(noline noticks nolabel) grid;
yaxis display=(noline noticks nolabel) grid;
keylegend / linelength=20;
run;
An extension of this idea is to have a "Response Color" for the series by a COLORRESPONSE variable. The SERIES plot does support COLORRESPONSE. But, then the entire series (or a segment for a grouped case) is colored by the response variable for the entire length of the series or segment. Consider the graph shown below:
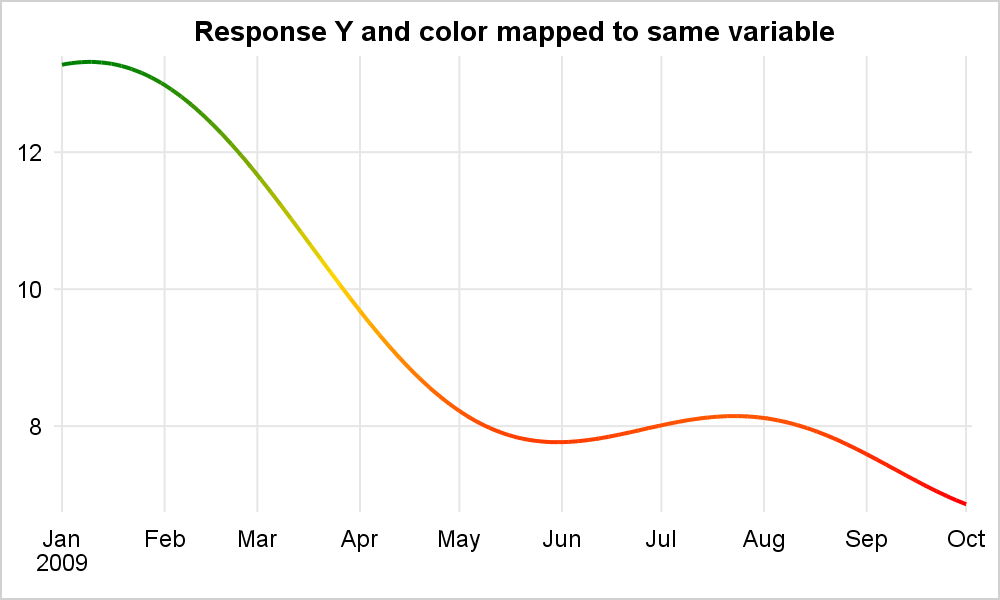
In this graph, we have the "appearance" of a single series, colored with varying color along the length of the curve based on a numeric color response variable using a COLORMODEL=(Red Gold Green). How do we create such a graph using SGPLOT. Well, the process is similar to the one above. We define the curve with segments that are marked with a group variable. In this case, every 4 points make up one segment, with a total of 90 segments. Once again, we have to make sure the last point of the previous curve segment is replicated as the first point of the next segment.
Now, we use the COLORRESPONSE option to color the curve by a numeric variable. In this case, it is the same as the y variable of the curve.
/*--Series with varying attributes--*/
title 'Response by Type by Date';
proc sgplot data=series2 noborder subpixel;
series x=date y=c / group=j colorresponse=c colormodel=(red gold green) lineattrs=(thickness=2);
xaxis display=(noline noticks nolabel) grid;
yaxis display=(noline noticks nolabel) grid;
run;
One caveat. These are really multiple segments drawn sequentially. At the inner joints, we use a join type that creates a bevel or other options. However, the end of a line segment is square, perpendicular to the line segment. So, the butt ends of two segments will be slightly angled to each other. This will show up as gaps when using very thick lines.
Full SGPLOT code: Series_Gradient


3 Comments
Thank you for sharing. How can we accomplish a similar task using GTL?
If you like the control of GTL, then I suggest you spend some time in the ODS Graphics Designer application. You can generate GTL (and present with PROC SGRENDER) and learn more about the supported syntax.
Hi, i have some problems with getting the code to work on my data. Does one of you have the opportunity to help me look at it?