A customer in SAS Communities recently asked a question that inspired me to create an animated GIF file by using PROC SGPLOT and SG Annotation. It is easy to inspire me to play with animation! Not all programming problems need to be serious.
Typically, we use PROC SGPLOT along with a BY statement to create animations. Each BY group contains one frame of the animation. In this animation, my goal is to animate text. When you animate text like this, there are some added data manipulations. Each frame must contain everything that was in the previous frame plus one more letter than previously appeared. You can do this in several ways. I will show you the way that I chose. I begin by creating a data set that contains the message.
data words; input line $ 1-20; datalines; Happy Holidays from Graphically Speaking! ; |
Next, I create a data set that contains X and Y coordinates; a text variable, Draw; and a BY variable, Order. An additional row number variable, k, is needed for subsequent data processing.
title;
footnote;
data message(drop=i line inc max);
   length draw $ 20;
   set words;
   x = 5; inc = 2.0; max = 11;
   do i = 1 to length(line);
      order + 1; y = max;
      do j = 1 to _n_ - 1;
         set words(rename=(line=draw)) point=j;
         y + -inc;
         k + 1; output;
         end;
      draw = substr(line, 1, i);
      y = max - _n_ * inc;
      if substr(line, i, 1) ne ' ' then do; k + 1; output; end;
   end;
   call symputx('maxorder', order);
run; |
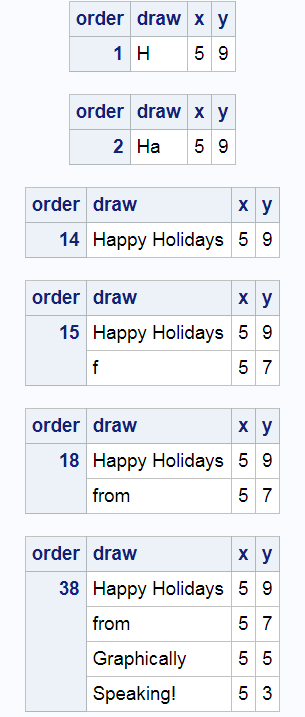
The DATA step reads each row of the message. The outer DO creates a new BY group for each character of each line of the input data set. This BY group contains the current line that is being built and all of the preceding lines. The preceding lines are read by using a SET statement and POINT=. The CALL SYMPUTX statement stores in a macro variable the maximum BY group number. The following step shows some of the BY groups.
proc print data=message(where=(order in (1, 2, 14, 15, 18, 38))); id order; by order; run; |
The next step creates two macro variables that contain the first and last observation number for the last BY group.
data _null_;
   set message(where=(order=&maxorder)) nobs=n1;
   call symputx('mino', k);
   call symputx('maxo', n1);
   stop;
run; |
The STOP statement stops processing the DATA step after one pass. All of the information is available in the first pass. The next step appends to the data set 5 copies of the final BY group, each with a new BY group number. This makes the animation seem to pause at the end before repeating.
data message(drop=j k); /* Pause */
   set message end=eof;
   output;
   if eof then do j = 1 to 5;
      do i = &mino to &maxo; set message point=i; order + j; output; end;
   end;
run; |
The next step creates an SG Annotation data set. It refers to an image that I found by searching the web for "free snowflake images". I stored the image in a file in my working directory called snowflake.jpg. This image fills the background of my graph.
data annoImage;
   retain Function 'image' Height Width 100 DrawSpace 'GraphPercent'
          Image 'snowflake.jpg' Layer 'back';
run; |
Finally, I run PROC SGPLOT along with all of the options that are needed to create an animated GIF.
ods _all_ close;
options papersize=('4 in', '3 in') printerpath=gif animation=start
        animduration=.25 animloop=yes noanimoverlay nonumber nodate nobyline;

ods printer file='holidaymessage.gif';
ods graphics / width=4in height=3in imagefmt=gif;

proc sgplot data=message nowall noborder noautolegend sganno=annoimage;
   by order;
   text  x=x y=y text=draw /  backlight=0.4 textattrs=(size=38 weight=bold color=white style=italic);
   xaxis values=(0 to 10) min=0 max=10 display=none;
   yaxis values=(0 to 10) min=0 max=10 display=none;
run;

options animation=stop byline;
ods printer close; |
The statement ODS _ALL_ CLOSE closes all open destinations. The OPTION statement sets a number of options that are needed for animation. PAPERSIZE= is a PDF and PRINTER option that sets the size of the area that will receive the results. ANIMLOOP=YES specifies continuous animation (looping). NOANIMOVERLAY displays each frame sequentially. NONUMBER, NODATE, and NOBYLINE suppresses page numbers, dates, and BY lines. The ODS PRINTER statement opens the printer destination and specifies the animated GIF file. The PROC SGPLOT suppresses some default output such as borders, legends, ticks, tick values, labels, and so on. The remaining statements end the animated GIF creation.
The coordinates range from 0 to 10. The X coordinate is a constant 5. The Y coordinate starts at 9 and gets smaller (by adding -2) for each subsequent line. If you have more lines, you will need to change the maximum and increment variables (max and inc) along with the font size (currently 38). I had never used the BACKLIGHT= option in the TEXT statement before. This option makes the text show up better on the different colors in the background.
For other animation examples, see:
Drawing and rotating an impossible triangle
Eclipse animation
Eclipse animation (part 2)
Sanjay and I and the dedicated groups at SAS that bring you ODS, ODS Graphics, and SAS/STAT wish everyone a safe and happy holiday season!


1 Comment
What fun! Happy Holidays to you too!