In the previous article on Getting Started with Vertical HighLow Plot, I described how we can use the HighLow plot to display the stock price by date. The HighLow plot is specifically designed for such use cases as shown below.
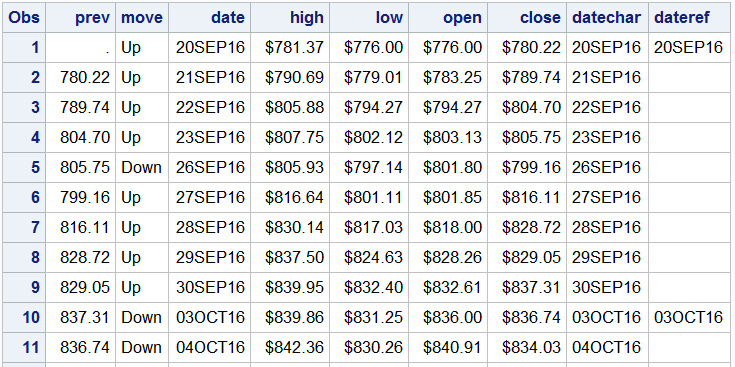
The data is downloaded from the Nasdaq web site, and converted into a SAS data set as shown below. A few additional columns are computed, such as move, datechar and dateref. Move represents whether the new close is up or down from previous close. "DateChar" is the date as a character string. DateRef is set to DateChart at the first working day of the month. A snippet of the data is shown here.
Now, we can display the High, Low, Open and Close values for the stock price by date. The program and graph are shown below.
title 'Stock Price for Amazon by Date'; proc sgplot data=amzn_1(where=(date > '01Jun2017'd)) noborder; highlow x=date low=low high=high / open=open close=close lineattrs=(thickness=2) y2axis; y2axis display=(noline noticks nolabel) grid; xaxis display=(nolabel); run; |
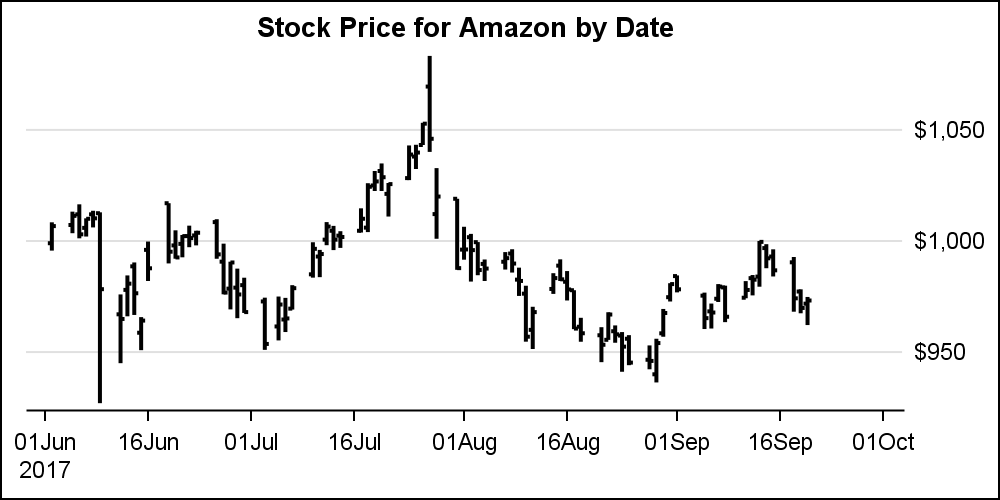
The y-axis is displayed on the right as is customary for such graphs. The x-axis is of type TIME since the x variable has a SAS date format. Note, the gaps in data when the market is closed, such as on Saturdays and Sundays, and other holidays. This is due to the correct scaled mapping of the date value on the x-axis.
While the above graph is technically correct, often the Stock Charts used in the financial domain do not display such gaps in the data, and the data for a Monday is shown immediately after Friday, without any gaps. This may also be useful when overlaying other derived statistics like moving averages and Bollinger Bands. Can we create such graphs using the SGPLOT procedure?
The answer, of course, is "Yes". To plot all the data in a continuous sequence we can set the x-axis TYPE=DISCRETE. This plots each date value adjacent to the previous value and each date is plotted equidistant from the previous, regardless of the value. We also set the DISCRETEORDER=Data to avoid any alphabetical sorting.
title 'Stock Price for Amazon by Date'; proc sgplot data=amzn_2(where=(date > '01Jun2017'd)) noborder; highlow x=datechar low=low high=high / open=open close=close lineattrs=(thickness=2) y2axis; y2axis display=(noline noticks nolabel) grid; xaxis type=discrete display=(nolabel) discreteorder=data; run; |

Now, we have each date value equally spaced, and the gaps in the data are removed. However, we have a busy x-axis with too many tick values drawn at an angle. We need a way to put back the nice date axis we had before. But, now the axis is no longer of type TIME. How do we get back the nice date tick values on the discrete axis?
AxisTable to the rescue. We can use the xAxisTable to display the axis tick values and suppress the actual x-axis. In the data step, I compute two new columns. The variable "DateChar" is the character date (same as what came in from the CSV data). The variable "DateRef" is the same as "DateChar" but only for the first occurrence of an observation in a month. Now, I can use this data to draw the chart with a discrete x-axis, suppressing the x-axis entirely. I can add a XAXISTABLE to display the "DateRef" values and reference lines.
title 'Stock Price for Amazon by Date'; proc sgplot data=amzn_2(where=(date > '01Jun2017'd)) noborder; refline dateref / axis=x lineattrs=graphgridlines; highlow x=datechar low=low high=high / open=open close=close lineattrs=(thickness=2) y2axis; xaxistable dateref / nolabel valueattrs=(weight=bold); y2axis display=(noline noticks nolabel) grid; xaxis type=discrete display=(nolabel novalues noticks) discreteorder=data; run; |
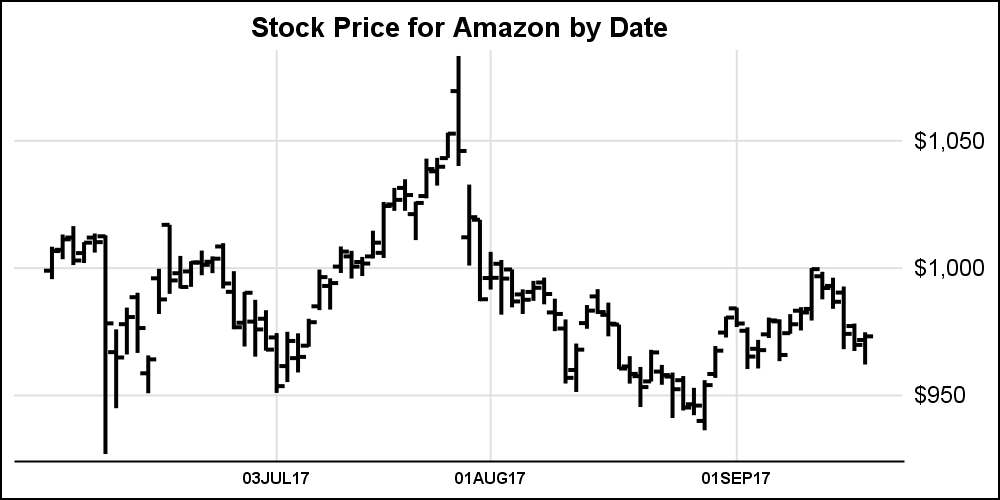
Now, we have a Stock Chart, showing all the stock trading values sequentially with no gaps. We have a nice axis that shows tick values at the start of each month. I displayed reference lines at each value. I used "DateChar" for the HIGHLOW plot, and "DateRef" for the REFLINE and the XAXISTABLE. Note the tick value in July is for 03 July, the first day in July the market is open.
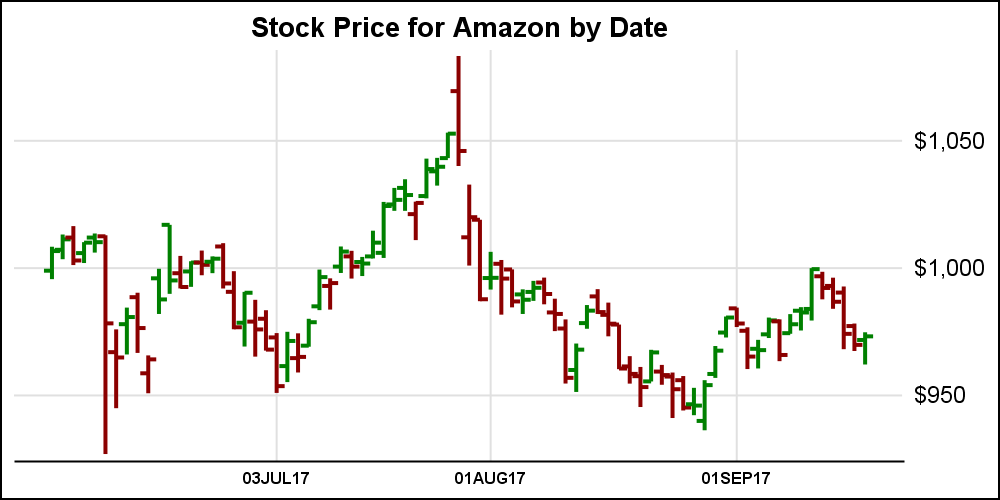
As a last step, I computed a "Move" variable that has "Up" when the new close is above previous close, and "Down" otherwise. Now, I can use the GROUP=move to display the up or down movement with different colors. I use a Discrete Attributes Map to set "Up" to Green and "Down" to Red color. See the full code linked below.
I discussed this with my team, and we feel we can build this behavior into the TIME axis, where the values are shown sequentially, with tick values shown only when the month or year interval value changes. Would you find such a feature useful? Please chime in.
Full SGPLOT code for Stock Charts: Stock_Chart


4 Comments
Always great tips and a nice demo of how things can be done so easily. Such techniques as above can be used to apply to other graphs, particularly once we get to 9.4. Best wishes
Yes, 9.4 has many great features. 9.4 maintenance release 5 will be out soon. It is time to upgrade. 🙂
This is very helpful. Responding to your request to chime in: yes, the behavior described in the last paragraph for a TIME axis would be great.
Another thing that would be helpful in a DISCRETE axis context would be to allow a separate variable to be used for labels and tickmark placement. For example, this would allow the user to create the precise display label in the dataset, while not impacting which values are displayed. This would allow for all observations to be plotted, but only displaying certain values on the XAXIS with tickmarks, and have everything line up properly. Thanks!
Thanks for sharing informative stock chart. Following these blogs helps in knowing the secret of success, business insights, and updates respectively. In this trending era, where people are looking for the marketing expert's guidance. For upcoming posts please let me know