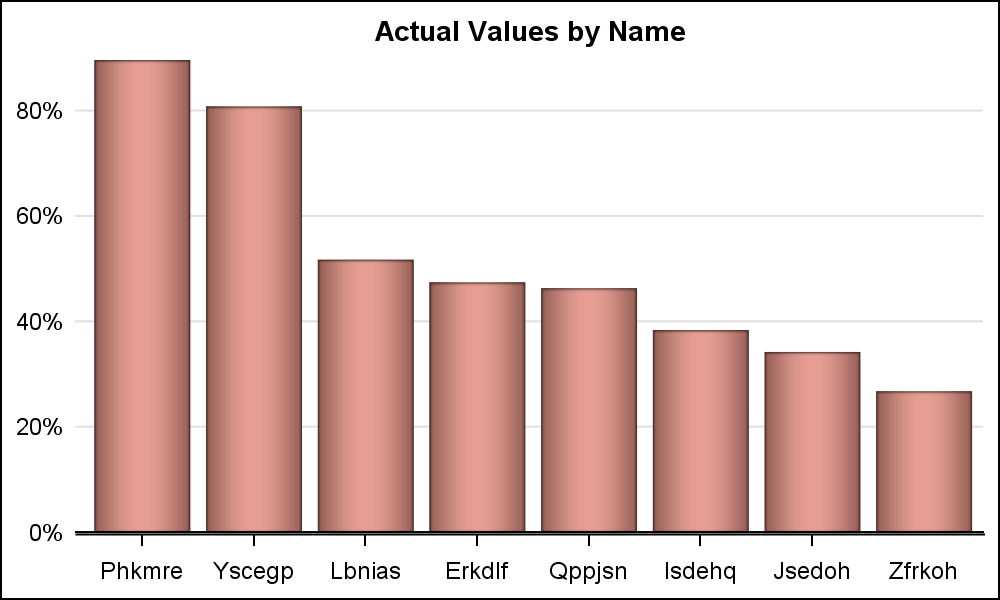
Often we have a graph with many bars (or categories) on the x or y axis. These categories may be sorted by descending response such as frequency of a % value. An example with simulated data is shown below.

title 'Actual Values by Name'; proc sgplot data=bars2 noborder; vbar name / response=actual nostatlabel dataskin=pressed fillattrs=graphdata1; xaxis discreteorder=data display=(nolabel) valueattrs=(size=7); yaxis display=(noticks noline nolabel) grid; run; |
Note, the x-axis is very cluttered, with values shown rotated to fit. With more data, the x-axis may be too cluttered and could be removed entirely.
Only the first few bars are significant, and the response may quickly drop off. In such a case, it is often beneficial to display only the first few bars or categories. Sadly, there is no option for a category axis to display only the first N observations. Yes, you can specify the categories you want to see, but then you need to provide the specific names of the categories to be displayed using the VALUES option.
While we will look into providing such an option in a future release, what can we do now? Fortunately, if you have SAS 9.4 or later release, there is a way to do this in a scalable manner, without having to know the details of the data.
First, I sorted the data in the order I want. Then, I assigned a new column called Id=_n_; So, ID contains the sorted index in the order I want. Then, I can plot the bar chart using ID as the category, and make the x-axis TYPE=linear. This will draw the values in the data order I want, and I can set the x-axis range as 1-8. Now, I don't want to see the ID values on the x-axis, but the Name values instead. I do this by suppressing the axis values and display the name using xAxisTable. Here is the result with the code.
title 'Actual Values by Name'; proc sgplot data=bars2 noborder; vbar id / response=actual nostatlabel dataskin=pressed fillattrs=graphdata2; xaxistable name / nolabel valueattrs=(size=9); xaxis type=linear values=(1 to 20 by 1) valueshint min=1 max=7.95 display=(novalues nolabel); yaxis display=(noticks noline nolabel) grid; run; |
Note the following:
- VBAR is displayed by ID.
- The x-axis values are suppressed.
- The XAXISTABLE is used to display the variable NAME by Id (Default).
- The x-axis is restricted to display all values from 1 to 8. VALUESHINT is needed, else the VALUES option wins.
The x-axis tick values are really drawn by the XAXISTABLE that is displaying the name of each bar id. The MIN and MAX settings allows you to display any data range on the linear axis. It would be possible to determine the index of the smallest bar you want to display, put that in a macro variable and use it to set the MAX option.
If the bars have other overlays, such as a lineplot, this will also work just fine as shown below. One can set the MIN and MAX values to cut off the bars at any point, even part of the way into the bar. Sometimes this could be useful to indicate to the reader of the graph that there are more bars to the right.

Note in this graph, I set the x-axis MAX=8.1. This allows the display of part of the 9th bar on the right. Now, the most significant bars are displayed clearly with their category values, while still indicating the existence of more more bars to the right.

Here is the same data displayed as an HBAR. Note in the linked code below, the yAxisTable is used for displaying the name values with POSITION=RIGHT. Also, we have used JUSTIFY=RIGHT to align the values towards the axis.
Full SGPLOT code: First_N_Bars


5 Comments
Looking at the last plot, without needing the predicted values, sometimes names are long, like for adverse events. What about having the name on top of the horizontal bars at top and then switching to the white space to right of the shorter bars when space becomes too limited about half-way down the plot?
Hans, you make a good point. Often we use the HBAR when we have long category names, or long data labels. We will release a new option with the HBAR statement with SAS 9.40M5 that will address this specific case. Your timely question will provide me an opportunity to describe this new option in an upcoming article.
Clever idea to truncate the axis and then use the AXISTABLE statement to display the variable names or labels. For those readers who might have merely skimmed the article, I want to emphasize that if you have RAW data, the first step is to summarize the data and compute a response variable, which you call the 'actual' variable. If you are interested in the number of observations (counts) in each category, you can use PROC FREQ to do the summarization. For details, see the article "Create a bar chart with only a few categories," which shows how to plot only the biggest N categories. If you want to aggregate the smaller categories together so that you display all the data, see "create a bar chart with an 'Others' category."
Why so complicated, plotting over ID, supressing values and using xaxistable?
>> proc sgplot data=bars2 noborder;
>> vbar id / response=actual nostatlabel dataskin=pressed fillattrs=graphdata2;
>> xaxistable name / nolabel valueattrs=(size=9);
>> xaxis type=linear values=(1 to 20 by 1) valueshint min=1 max=7.95 display=(novalues nolabel);
>> yaxis display=(noticks noline nolabel) grid;
>> run;
I have got the same graph with:
proc sgplot data=bars2 noborder;
where id<9;
vbar name / response=actual nostatlabel dataskin=pressed fillattrs=graphdata2 categoryorder=respdesc;
xaxis display=(nolabel);
yaxis display=(noticks noline nolabel) grid;
run;
can the same thing be done with proc gchart? If so, can you provide the code?