When you run PROC SGPLOT, it writes a graph template and uses it to create a graph. You can then use that template to create the graph with PROC SGRENDER. You can also edit the template and then create a modified graph. This can be handy when PROC SGPLOT almost does what you want, but you need to use the GTL to control an option that is not available in PROC SGPLOT.
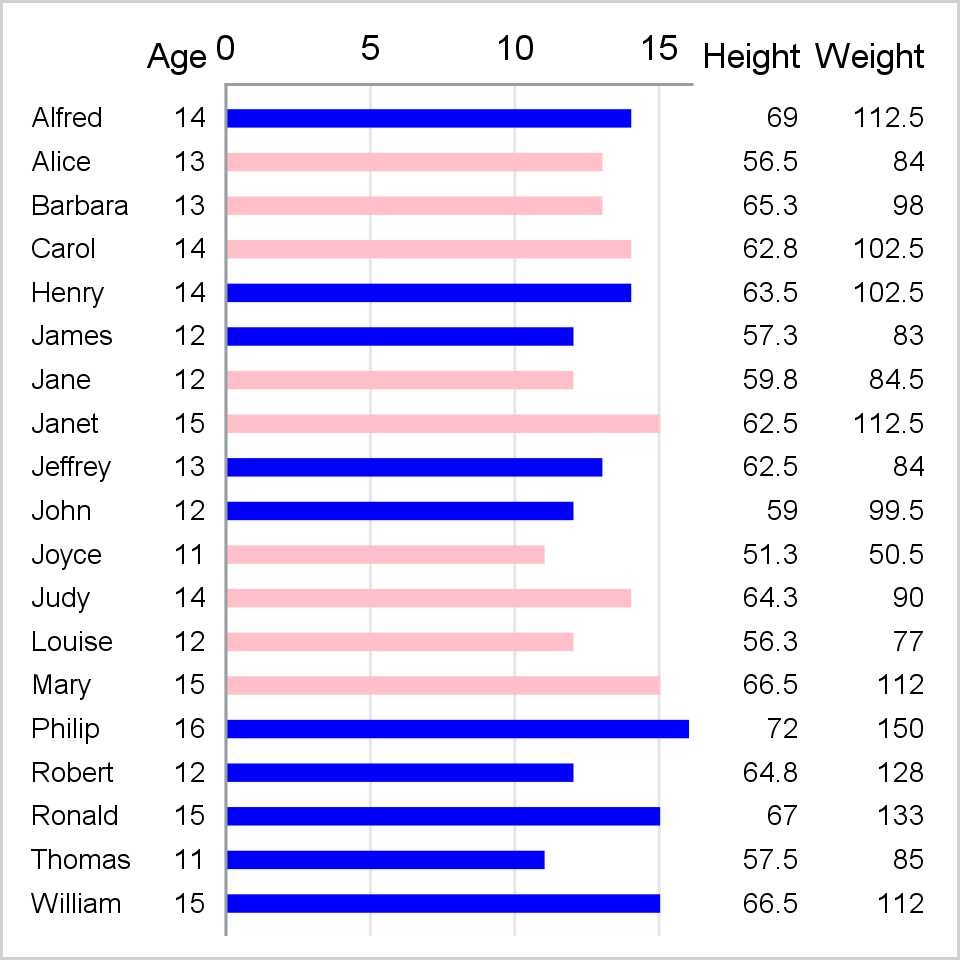
Consider the following step, which creates a horizontal bar chart along with four axis tables:
title; ods graphics on / width=480 height=480; proc sgplot data=sashelp.class noborder tmplout='temp.txt' noautolegend; styleattrs datacolors=(blue pink); yaxistable name age / y=name position=left; hbarparm category=name response=age / x2axis group=sex barwidth=0.4 nooutline; yaxistable height weight / y=name position=right; yaxis display=none; x2axis display=(noticks nolabel) grid; label name='00'x; run; |
Click on a graph to enlarge.
File temp.txt
The TMPLOUT= option writes the graph template to a file, temp.txt. You can edit that file to make a modified template. However, the template in the file is hard to read because the lines are long and are not properly indented. Here is an easy way to create a second file that contains an indented template:
%inc 'temp.txt' / nosrc; filename temp 'temp2.txt' lrecl=80; proc template; source sgplot / file=temp; quit; |
File temp2.txt
The %INC statement compiles the template that PROC SGPLOT wrote. PROC TEMPLATE along with the SOURCE statement displays template source code. The FILE= option writes that source code to a file. This code is indented.
You can edit this code with an editor. You can instead edit either the original or the indented file by using a DATA step. The following step changes the template name and specifies explicit column weights (proportions) for each column:
data _null_;
   infile 'temp.txt';
   input;
   _infile_ = tranwrd(_infile_, 'statgraph sgplot', 'statgraph axistables');
   _infile_ = tranwrd(_infile_, 'columnweights=preferred',
                     'columnweights=(0.2 0.1 0.4 0.15 0.15)');
   call execute(_infile_);
run;

proc sgrender data=sashelp.class template=axistables;
run; |
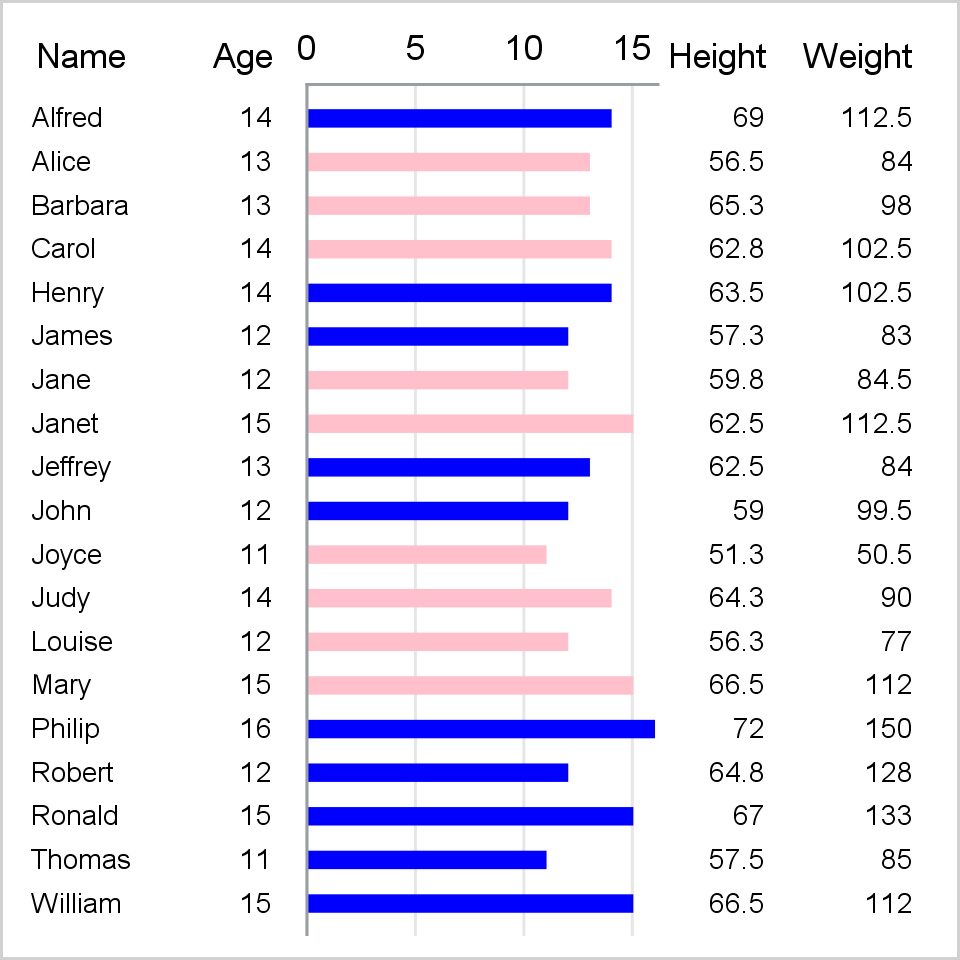
The DATA step reads each line from the file temp.txt. The TRANWRD function changes two lines translating one string into another. The CALL EXECUTE statement writes out the original and the modified lines. PROC SGRENDER creates the graph using the modified template.
By default, the PROC SGPLOT template determines how wide to make each column based on the contents of the column. This is almost always fine, but if you have a BY variable, you might want the column widths to be the same for each graph. By using a DATA step instead of an editor to modify your template, you ensure that your results are reproducible. You can incorporate the template editing directly into production SAS jobs.


2 Comments
Editing the Template that PROC SGPLOT Writes is an Excellent, Excellent BLOG. Thank you so much for writing it. I can use it.
Crystal clear explanations. Thank you.