A Spider Plot is another way of presenting the Change from Baseline for tumors for each subject in a study by week. The plot can be classified by response and stage. Another way of displaying Tumor Response data was discussed earlier in the article on Swimmer Plot.
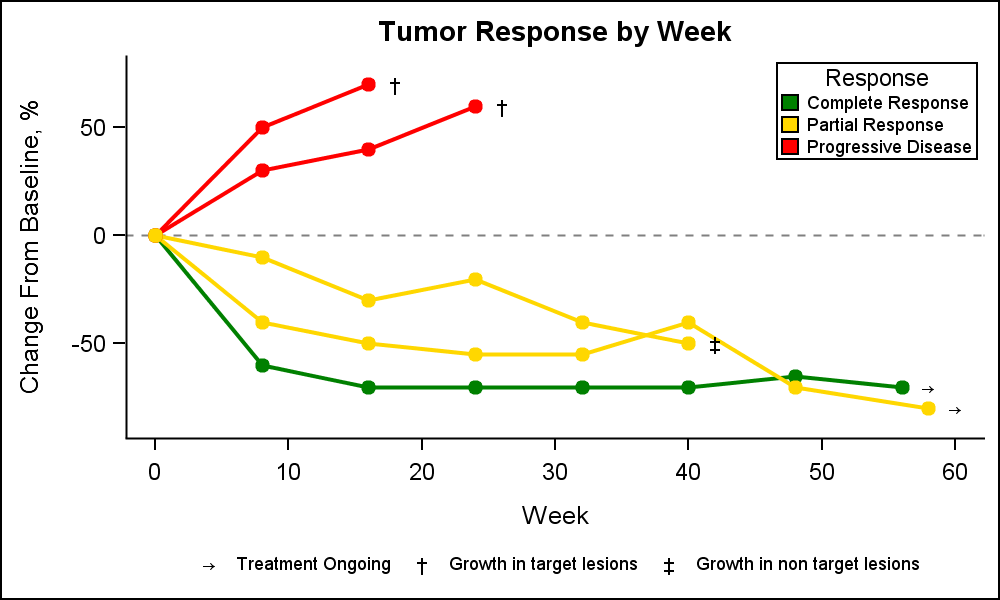 This article is prompted by a question on the SAS communities page on how to create a Spider plot. The user provided an illustration of what the plot might look like. I followed the example and generated some data to create the graph shown on the right. Click on the graph for a higher resolution view.
The data is arranged in six columns. Four columns are needed to draw the progression of the disease for each subject over time: Subject, Week, Change, RGroup.
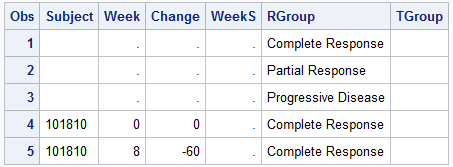 Two additional columns are used to display the status at the end of the curve for each subject: WeekS, TGroup. The first three observations are just to ensure the groups are assigned colors in the order we want. A Discrete Attributes Map can be used, but I ran into some minor difficulties, so I skipped that step. This exercise helped reveal a minor problems, but I was able to work around it.
In this case, WeekS=Week+2 in this case, to position the marker at the right of the curve. Only the last point in the curve has this nonmissing value.
The SAS 9.4M2 options for coloring the series and markers by another classifier (GroupLC and GroupMC) is used to color each curve for the Subject by the Response Group (RGroup). Note, the connectivity for each curve is determined by setting Group=Subject. Then, with in this, the color of each curve is set by setting GroupLC=RGroup. This allows multiple curves to be classified in the same category.
The SAS 9.40M1 SymbolChar statement is used to define a few symbols to represent the status of each Subject, such as "Treatment Ongoing" etc. These are inserted into the group symbols list using the DataSymbols option. Custom group data colors are set using the DataContrastColor option.
A Scatter plot is used to display these markers.
SAS 9.4M2 SGPLOT Code:
title "Tumor Response by Week";
ods graphics / reset width=5in height=3in imagename='Spider';
proc sgplot data=spider noborder tmplout='c:\spider.sas';
format tgroup $growth.;
symbolchar name=ongoing char='2192'x / scale=1;
symbolchar name=growtht char='2020'x / scale=1;
symbolchar name=growthnt char='2021'x / scale=1;
styleattrs datacontrastcolors=(green gold red)
datasymbols=(ongoing growtht growthnt );
refline 0 / lineattrs=(pattern=shortdash);
series x=week y=change / group=subject grouplc=rgroup groupmc=rgroup
markers markerattrs=(symbol=circlefilled)
lineattrs=(thickness=2 pattern=solid) name='a';
scatter x=weekS y=change / group=TGroup markerattrs=(size=16 color=black)
nomissinggroup name='b';
keylegend 'a' / title='Response' type=linecolor valueattrs=(size=7)
location=inside position=topright across=1 opaque;
keylegend 'b' / valueattrs=(size=7) noborder;
xaxis label='Week';
run;
There are also examples of Spider plots with negative date values on the x-axis. These appear to track the disease state before and after start of treatment. The above code will likely work if the data itself includes values from before start of treatment and the baseline value is 1.0.
Full SAS 9.4M2 SGPLOT code: spider

19 Comments
It looks like the "spider plot" is essentially a spaghetti plot for relative change from baseline. You could also use a lasagna plot for this kind of data.
The name is likely relevant for the domain. Just like a "Waterfall" chart for Oncology is essentially a bar chart. 🙂
Thank you for sharing this with us. Very useful. But I have a question here: is it possible to show the legend as lines instead of squares with different colors? The grouping uses line color attribute not the line style, so it won't work if I change the type= option in the keylegend statement to 'line'. But is there any other way to make such change? Thanks!
Yes, that is doable. First I thought you could just change the TYPE=LINECOLOR in the KEYLEGEND to TYPE=LINE. But that did not work since then you get all 5 lines in the legend since each has a different GROUP. So, an "elegant hack" is to change the appearance of the color block into a color line. You can do that by using the FILLHEIGHT, FILLASPECT and AUTOOUTLINE options.
keylegend 'a' / title='Response' type=linecolor valueattrs=(size=7) autooutline
location=inside position=topright across=1 opaque fillheight=3 fillaspect=5;
Hi Sanjay,
I want to make part of the line bold by complete response and partial response
Individual line thicknesses can be controlled.
See: https://blogs.sas.com/content/graphicallyspeaking/2015/09/21/response-colors-and-thickness/
Hi Sanjay, what are the changes that needs to be done in the code above so it will work in SAS 9.3?
Thanks!
In SAS 9.3, the SYMBOLCHAR and STYLEATTR statements are not available to you. You would need to create a small ODS style that inherits from the main ODS style to override the group colors and markers. The rest of the code should work fine.
I need to display graph as below :
This figure presents the spider plot of individual changes from baseline in MDS-UPDRS part III total score over time by treatment group. All treatment groups will be displayed in the same figure. Different line types and color will be used to identify the treatment groups.
Axis labels:
• X-axis: Time Points(mins)
• Y-axis: MDS-UPDRS part III total score
I don't have rgroup variable. I have atptn(time points) and chg(change from baseline) variables with subject and treatment level info.
I have tried using above given code but I do have 4 treatments in data so what will be value for 4th treatment in symbolchar statement. Moreover can I use proc template to define characteristic of treatment groups?
The symbol you choose for the fourth treatment group can be whatever you want to uniquely identify the status of the subject. As for controlling the attributes of each treatment group,it would be best to remove the STYLEATTRS statement and use a DATTRMAP (discrete attributes map), which will give you the ability to control the attributes of each treatment group, regardless of data order. See this blog post for more details: https://blogs.sas.com/content/graphicallyspeaking/2012/02/27/roses-are-red-violets-are-blue/
Valuable info. Lucky me I discovered your website accidentally,
and I am shocked why this accident did not took place earlier!
I bookmarked it.
Hello Sanjay, how can I higlight one group shading the others ? I have only one line "series" and do not use an attrmap since I have an issue with it for colours.
Thank you in advance.
Reza
Hi Sanjay,
Very informative.
Just wanted to know what if we wanted to show the dots for each time point as different for each line and use the same for legend. right now you have circles in body and squares for legend.
will appreciate your feedback.
raj
Hey Raj, the key here is that he has TYPE=LINECOLOR on the KEYLEGEND statement, so you only get a color swatch of the line color. If you remove that option, you should get a legend chiclet that looks more like the series plot. Hope this helps!
Hi Sanjay,
Thank you very much for these great tips and support in generating very useful graph. I have one question around this spider plot and was wondering if you could help. Considering the example data in this spider plot, lets say there is one patient who have partial response at first two time point and at the third timepoint the patient has complete response. Lets consider the second yellow line in the plot. So if that patient has complete response at the third timepoint after partial response at first 2 timepoints, how could we make the line colour and circle change according to the response from second timepoint to third timepoint?
Is this something that can be done with this existing example code?
Many thanks for looking into this and for your time.
Thanks.
Rafi
The existing template should work fine, but you will need to do a little data manipulation to get just what you want. When a subject changes response state, you will need to create two data records: the first using the PREVIOUS response group value and then a duplicate record using the CURRENT response group value. The series plot will then appear to transition to the new response. If you sort the data, make sure you sort it by the X variable. Let me know if this works for you.
Thank you very much Dan for your swift response! I applied the solution but it seems just the circle colour changes, not the line connecting from previous timepoint. I tried to update the last patient data from the example code to be like this -
103205 0 0.0 . Partial Response
103205 8 -0.4 . Partial Response
103205 16 -0.5 . Partial Response
103205 24 -0.55 . Partial Response
103205 32 -0.55 . Partial Response
103205 40 -0.65 . Partial Response * Duplicated previous response;
103205 40 -0.65 . Complete Response * Current response;
103205 48 -0.70 . Partial Response
103205 58 -0.80 58 Partial Response Ongoing
Perhaps I am doing not exactly as you mentioned?
Thanks.
Rafi
This response change needs to happen for both the "rgroup" and "TGroup" variables so that both the series and the scatter are affected.
For the record, one other required change was to make sure that the GROUP variable on the SERIES plot is unique every time the GROUPLC and GROUPMC value changes for a subject. The reason is that the line color for a given GROUP value will not change once the line is started. To do this, create another column that combines attributes such as subject and response into one string value and use that for the GROUP instead of the subject variable.