There are many ways to use a heat map. For big data sets, heat maps provide a substitute for scatter plots. Heat maps can also be used to enhance small tables. Several of my colleagues (Sanjay Matange, Pratik Phadke, Rick Wicklin, Chris Hemedinger, and probably others) have posted about using heat maps to display tables. This post shows how to outline selected cells in the table and display multiple values in each cell.
Click on a graph to enlarge.
(Author note, August 12, 3:30 PM: As questions came in about how to enhance my second example, I consulted my colleague Prashant Hebbar, who guided me toward more elegant code. I have revised my second example and my replies accordingly. The new code relies on the options POSITION=TOP and POSITION=BOTTOM instead of DISCRETEOFFSET=-0.15 and DISCRETEOFFSET=0.15 to put values on multiple lines. Thanks, Prashant!)
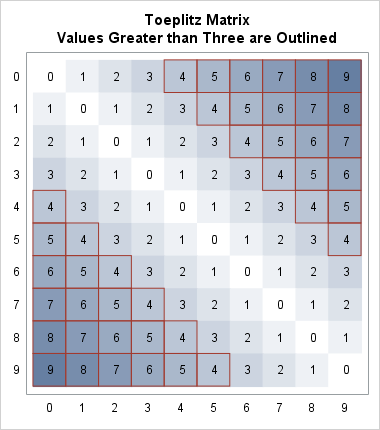
A Toeplitz matrix is used to illustrate this idea, since the values have a simple pattern. In this example, you will learn how to put an outline around some of the cells (those that have values greater than three). The first step creates a 10 x 10 Toeplitz matrix with entries 0 to 9. PROC IML creates a matrix that is arrayed in a single column for plotting, and it creates a SAS data set of values, row labels, and column labels.
proc iml; /* Create a Toeplitz matrix   */
   t = 9; /* Values range from 0 to t */
   x = (0:t)` @ j(t + 1, 1, 1) || j(t + 1, 1, 1) @ (0:t)` ||
       shape(toeplitz(0:t), 1)`;
   create mat from x[colname={"RowLab" "ColLab" "Value"}];
   append from x;
quit; |
The function toeplitz(0:t) creates a 10 x 10 matrix, shape(toeplitz(0:t), 1) converts the matrix to a 1 x 100 row vector, and shape(toeplitz(0:t), 1)` transposes the row vector to make a 100 x 1 column vector to plot.
The second step creates a macro variable whose value controls the size of the cells for plotting. Approximately an 18 x 18 pixel square is reserved for each cell. The Outline variable has nonmissing values when the value is greater than 3. These are the cells that are outlined.
data mat2;
   if _n_ = 1 then /* Scale matrix size by the number or rows/columns */
      call symputx('size', ceil(18 * sqrt(n)));
   set mat nobs=n;
   Outline = ifn(Value > 3, Value, .); /* Outline the nonmissing values (Value > 3) */
   output;
run;

proc print data=mat2(obs=11);
   id RowLab ColLab;
run;

%put &size; |
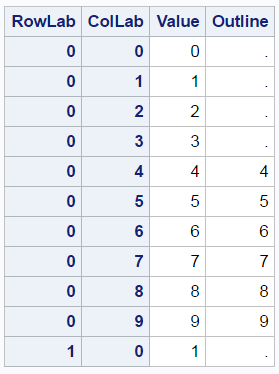
Here are 11 of the 100 observations:
The template creates a graph that is 250+180=430 pixels high and 200+180=380 pixels wide. The height is greater than the width to provide space for titles. The first HEATMAPPARM statement creates a heat map that displays values of the Value variable from 0 to 9 as colors ranging from white (GraphWalls:Color) to blue (ThreeColorRamp:StartColor). The second HEATMAPPARM statement outlines the nonmissing values of the variable Outline. It uses the option FILLATTRS=(TRANSPARENCY=1) to suppress the heat map and only display outlines. The TEXTPLOT statement displays the values overlaid on of the shaded cells.
proc template;
   define statgraph matrix;
      begingraph / designheight=%eval(250+&size) /* Size: a bit higher than wider */
                   designwidth =%eval(200+&size);
         entrytitle "Toeplitz Matrix";
         entrytitle "Values Greater than Three are Outlined";
         layout overlay / yaxisopts=(discreteopts=(tickvaluefitpolicy=none)
                                     display=(tickvalues) reverse=true)
                          xaxisopts=(discreteopts=(tickvaluefitpolicy=rotate)
                                     display=(tickvalues));
            * Heat map provides the background color for each cell;
            heatmapparm y=RowLab x=ColLab colorresponse=Value /
               ColorModel=(GraphWalls:Color ThreeColorRamp:StartColor);
            * Heat map provides the outlines;
            heatmapparm y=RowLab x=ColLab colorresponse=Outline /
               ColorModel=(GraphWalls:Color ThreeColorRamp:StartColor)
               display=all includemissingcolor=false fillattrs=(transparency=1)
               outlineattrs=graphdata2(thickness=1);
            * Textplot provides the values;
            textplot y=RowLab x=ColLab text=eval(put(Value, 2.)) /
                     textattrs=(size=12px) position=center;
         endlayout;
      endgraph;
   end;
run;

proc sgrender data=mat2 template=matrix;
run; |
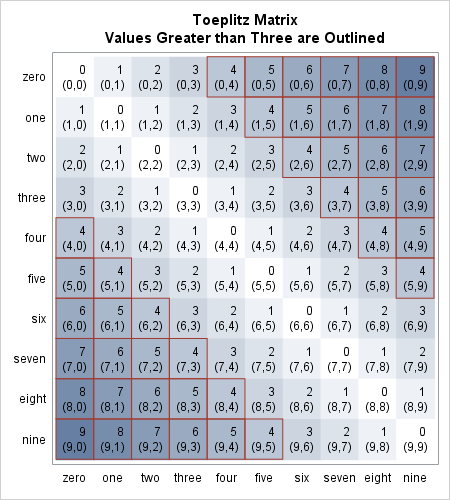
The next example creates the same Toeplitz matrix as before. However, this time the DATA step creates character row and column labels. The DATA step also creates a second variable that contains the cell indices. Larger cells are created (approximately 32 x 32 pixels), which are large enough to display the additional values. A second TEXTPLOT statement displays the cells. Each TEXTPLOT statement has POSITION= option that positions text either at the top or bottom of each cell.
proc iml; /* Create a Toeplitz matrix   */
   t = 9; /* Values range from 0 to t */
   x = (0:t)` @ j(t + 1, 1, 1) || j(t + 1, 1, 1) @ (0:t)` ||
       shape(toeplitz(0:t), 1)`;
   create mat3 from x[colname={"r" "c" "Value"}];
   append from x;
quit;

data mat4;
   if _n_ = 1 then /* Scale matrix size by the number or rows/columns */
      call symputx('size', ceil(25 * sqrt(n)));
   set mat3 nobs=n;
   Outline = ifn(Value > 3, Value, .); /* Outline the nonmissing values (Value > 3) */
   RowLab = put(r, words5.);
   ColLab = put(c, words5.);
   Cell   = cats('(', r, ',', c, ')');
   output;
run;

proc template;
   define statgraph matrix;
      begingraph / designheight=%eval(250+&size) /* Size: a bit higher than wider */
                   designwidth =%eval(200+&size);
         entrytitle "Toeplitz Matrix";
         entrytitle "Values Greater than Three are Outlined";
         layout overlay / yaxisopts=(discreteopts=(tickvaluefitpolicy=none)
                                     display=(tickvalues) reverse=true)
                          xaxisopts=(discreteopts=(tickvaluefitpolicy=rotate)
                                     display=(tickvalues));
            * Heat map provides the background color for each cell;
            heatmapparm y=RowLab x=ColLab colorresponse=Value /
               ColorModel=(GraphWalls:Color ThreeColorRamp:StartColor);
            * Heat map provides the outlines;
            heatmapparm y=RowLab x=ColLab colorresponse=Outline /
               ColorModel=(GraphWalls:Color ThreeColorRamp:StartColor)
               display=all includemissingcolor=false fillattrs=(transparency=1)
               outlineattrs=graphdata2(thickness=1);
            * Textplot provides the values;
            textplot y=RowLab x=ColLab text=eval(put(Value, 6.)) /
                     position=top textattrs=(size=12px);
            textplot y=RowLab x=ColLab text=cell / position=bottom
                     textattrs=(size=12px);
         endlayout;
      endgraph;
   end;
run;

proc sgrender data=mat4 template=matrix;
run; |

7 Comments
Nice post. A shortcut for generating the Toeplitz data is to use the EXPANDGRID function in SAS/IML to generate the subscript columns:
For a quick-and-dirty visualization of the Toeplitz matrix, you can use the HEATMAPCONT subroutine directly from SAS/IML, although it doesn't provide support for overlaying multiple layers:
For SAS programmers who have SAS 9.4m3, the HEATMAP statement is now available in PROC SGPLOT, which means that you can generate images like these without using the GTL:
proc sgplot data=mat4 noautolegend; heatmap x=ColLab y=RowLab / colorresponse=Value colormodel=TwoColorRamp; heatmap x=ColLab y=RowLab / outline colorresponse=Outline fillattrs=(transparency=1) outlineattrs=graphdata2(thickness=1); text x=ColLab y=RowLab text=Value / textattrs=(size=16pt); yaxis display=(nolabel) reverse; xaxis display=(nolabel); run;Thanks Rick! Like you, I prefer using SGPLOT when I can. For this example, I required more control than I could get with a heatmap in SGPLOT, so I used the GTL.
Very nice chart. I especially like the text layer. Do you know if each cell can support adding a marker symbol like a small square in the bottom right corner to add a text layer over?
Thanks Brian! Yes! The code below differs from the last example in that I add a variable Entry to the data set. Then I add two SCATTERPLOT statements: one to make the small square and one to add text.
(Author note, August 12, 3:30 PM: As questions came in about how to enhance my second example, I consulted my colleague Prashant Hebbar, who guided me toward more elegant code. I have revised my second example and my replies accordingly. The new code relies on the options POSITION=TOP and POSITION=BOTTOM instead of DISCRETEOFFSET=-0.15 and DISCRETEOFFSET=0.15 to put values on multiple lines. Thanks Prashant!)
proc iml; /* Create a Toeplitz matrix */ t = 9; /* Values range from 0 to t */ x = (0:t)` @ j(t + 1, 1, 1) || j(t + 1, 1, 1) @ (0:t)` || shape(toeplitz(0:t), 1)`; create mat5 from x[colname={"r" "c" "Value"}]; append from x; quit; data mat6; if _n_ = 1 then /* Scale matrix size by the number or rows/columns */ call symputx('size', ceil(32 * sqrt(n))); set mat5 nobs=n; Outline = ifn(Value > 3, Value, .); /* Outline the nonmissing values (Value > 3) */ RowLab = put(r, words5.); ColLab = put(c, words5.); Cell = cats('(', r, ',', c, ')'); output; Entry + 1; run; proc template; define statgraph matrix; begingraph / designheight=%eval(250+&size) /* Size: a bit higher than wider */ designwidth =%eval(200+&size); entrytitle "Toeplitz Matrix"; entrytitle "Values Greater than Three are Outlined"; layout overlay / yaxisopts=(discreteopts=(tickvaluefitpolicy=none) display=(tickvalues) reverse=true) xaxisopts=(discreteopts=(tickvaluefitpolicy=rotate) display=(tickvalues)); * Heat map provides the background color for each cell; heatmapparm y=RowLab x=ColLab colorresponse=Value / ColorModel=(GraphWalls:Color ThreeColorRamp:StartColor); * Heat map provides the outlines; heatmapparm y=RowLab x=ColLab colorresponse=Outline / ColorModel=(GraphWalls:Color ThreeColorRamp:StartColor) display=all includemissingcolor=false fillattrs=(transparency=1) outlineattrs=graphdata2(thickness=1); * Textplot provides the values; textplot y=RowLab x=ColLab text=eval(put(Value, 7.)) / position=top textattrs=(size=12px); textplot y=RowLab x=ColLab text=cell / position=bottom textattrs=(size=12px); * Add a small square; scatterplot y=RowLab x=ColLab / markerattrs=graphdata2(symbol=squarefilled size=15 transparency=0.6) discreteoffset=0.35; * Add text to the square; scatterplot y=RowLab x=ColLab / markercharacter=eval(put(entry, 2.)) discreteoffset=0.35; endlayout; endgraph; end; run; proc sgrender data=mat6 template=matrix; run;Thank you so much. I've created a multi-dimensional graph using this information. Invaluable to me.
Warren,
I think this is an excellent way of displaying even a large table when you want to bring attention to certain values. I am trying to adapt it to a tall, skinny table (13 rows, 4 columns) and Proc Template does not seem to be responding to even hard-coded values in the designwidth= option.
Also, suppose I would like a different color scheme? I am struggling to get the heatmap to go from green to red through white.
Chris
Thanks Chris! Here I changed the size of the matrix and I adjusted the design height and width. It usually takes me a few iterations to specify sizes that work. I changed the color model to: ColorModel=(green white red).
(Author note, August 12, 3:30 PM: As questions came in about how to enhance my second example, I consulted my colleague Prashant Hebbar, who guided me toward more elegant code. I have revised my second example and my replies accordingly. The new code relies on the options POSITION=TOP and POSITION=BOTTOM instead of DISCRETEOFFSET=-0.15 and DISCRETEOFFSET=0.15 to put values on multiple lines. Thanks Prashant!)
proc iml; /* Create a Toeplitz matrix   */
   t = 12; /* Values range from 0 to t */
   x = (0:t)` @ j(t + 1, 1, 1) || j(t + 1, 1, 1) @ (0:t)` ||
       shape(toeplitz(0:t), 1)`;
   create mat7 from x[colname={"r" "c" "Value"}];
   append from x;
quit;

data mat8;
   set mat7 nobs=n;
   Outline = ifn(Value > 3, Value, .); /* Outline the nonmissing values (Value > 3) */
   RowLab = put(r, words7.);
   ColLab = put(c, words7.);
   Cell   = cats('(', r, ',', c, ')');
   if c le 4 then output;
run;

proc template;
   define statgraph matrix;
      begingraph / designheight=%eval(250+16*25)
                   designwidth =%eval(200+ 4*25);
         entrytitle "Subset of a Toeplitz Matrix";
         entrytitle "Values > Three are Outlined";
         layout overlay / yaxisopts=(discreteopts=(tickvaluefitpolicy=none)
                                     display=(tickvalues) reverse=true)
                          xaxisopts=(discreteopts=(tickvaluefitpolicy=rotate)
                                     display=(tickvalues));
            * Heat map provides the background color for each cell;
            heatmapparm y=RowLab x=ColLab colorresponse=Value /
               ColorModel=(green white red);
            * Heat map provides the outlines;
            heatmapparm y=RowLab x=ColLab colorresponse=Outline /
               ColorModel=(green white red)
               display=all includemissingcolor=false fillattrs=(transparency=1)
               outlineattrs=graphdata2(thickness=1);
            * Textplot provides the values;
            textplot y=RowLab x=ColLab text=eval(put(Value, 7.)) /
                     position=top textattrs=(size=12px);
            textplot y=RowLab x=ColLab text=cell / position=bottom
                     textattrs=(size=12px);
         endlayout;
      endgraph;
   end;
run;

proc sgrender data=mat8 template=matrix;
run;