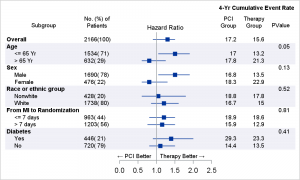
The advent of the AXISTABLE statement with SAS 9.4, has made it considerably easier to create graphs that include statistics aligned with x-axis values (Survival Plot) or with the y-axis (Forest Plot). This statement was specifically designed to address such needs, and includes the options needed to control the text attributes of the data and also any indentations that may be needed.
In previous posts, I have described the use of these new statements, but it seems I did not provide a full program for the "Subgrouped Forest Plot", one of many popular clinical graphs. Here we can use the YAXISTABLE available in SGPLOT for this graph
 Here is the graph I created using the SGPLOT procedure. Click on the graph to see a higher resolution image. The details for the graph are as follows:
- A Hazard Ratio plot in the middle.
- Study names on the far left. The study names are subgrouped, with label and values. The labels have bolder font and the values are indented.
- Number of patients with % on the left.
- Event rates for PCI Group, Therapy Group and p-value on the right.
- Note the use of Unicode arrow characters for the annotations on the axis created using the TEXT plot statement. This is done using the ability to add Unicode values to a User Defined Format in SAS 9.4M3.
- SG Annotation code is NOT used in this graph.
SAS 9.40M3 code:
title j=r h=7pt '4-Yr Cumulative Event Rate';
ods graphics / reset width=5in height=3in imagename='Subgroup_Forest_SG_94';
proc sgplot data=forest_subgroup_2 nowall noborder nocycleattrs dattrmap=attrmap noautolegend;
format text $txt.;
styleattrs axisextent=data;
refline ref / lineattrs=(thickness=13 color=cxf0f0f7);
highlow y=obsid low=low high=high;
scatter y=obsid x=mean / markerattrs=(symbol=squarefilled);
scatter y=obsid x=mean / markerattrs=(size=0) x2axis;
refline 1 / axis=x;
text x=xl y=obsid text=text / position=bottom contributeoffsets=none strip;
yaxistable subgroup / location=inside position=left textgroup=id labelattrs=(size=7)
textgroupid=text indentweight=indentWt;
yaxistable countpct / location=inside position=left labelattrs=(size=7) valueattrs=(size=7);
yaxistable PCIGroup group pvalue / location=inside position=right pad=(right=15px)
labelattrs=(size=7) valueattrs=(size=7);
yaxis reverse display=none colorbands=odd colorbandsattrs=(transparency=1) offsetmin=0.0;
xaxis display=(nolabel) values=(0.0 0.5 1.0 1.5 2.0 2.5);
x2axis label='Hazard Ratio' display=(noline noticks novalues) labelattrs=(size=8);
run;
I have also added this code to the CTSPedia page for Subgrouped Forest Plot.
Full SAS 9.40M3 code: Subgrouped_Forest_Plot_SG_94

14 Comments
Hi Sanjay,
Can you please elaborate on why you used the second scatter plot statement?
"scatter y=obsid x=mean / markerattrs=(size=0) x2axis;"
Thanks
Curious Kid
Good catch. Note, the Hazard plot has a normal x-axis at the bottom, and also an additional x2-axis at the top, displaying the axis label only. In order to enable a x2 axis, we need a plot statement associated with the x2 axis. So, I used a second SCATTER statement and associated it with the X2 axis, and set the display option to show the label only. Since I don't really need to see the markers from the 2nd scatter plot, I set the marker size to zero.
scatter y=obsid x=mean / markerattrs=(size=0) x2axis;
Pingback: Graph Table with Class - Graphically Speaking
Thanks for sharing. I try your code , but it can't work out. Is it because of my sas version(SAS® 9.4 TS1M2)?
Should work with SAS 9.40M2. Maybe comment out the TEXTPLOT.
Also having trouble with the code, specifically with the textgroup=id labelattrs=(size=7) textgroupid=text indentweight=indentWt. Wondering if this is because I have SAS 9.4 M2 instead of M3.
These options are available with SAS 9.40M1.
I am unable to get this to work either.
I have SAS 9.4M2.
Pingback: Tips and tricks - Transparent margins - Graphically Speaking
The YAXISTABLE label "No. (%) of Patients" is split in the space after "of". Suppose I wanted to split it before "of". How could I do this? There doesn't seem to be any way to use a SPLITCHAR option in a YAXISTABLE label statement.
Hmmm. You are right, there is no such flexibility. My guess to do what you want would be to replace the space in "of patients" with a nbsp. So, to the code this will become one continuous word, and splitting will not happen here.
How to create x axis that will display HR units in log base 10 logarithms intervals, but showing the normal scale values though?
Thanks Sanjay for sharing the codes. I used the one for SAS 9.4 to create my forest plot, everything worked well except the horizontal band not located at the right place. Could you please let me know how could I remove those bands? Thank you very much!
Hi,
My questions are below:
1) How to add an underline for the yaxistable label?
2) How to leave a line-space between each subgroups?
3) How to fow to the next page when there is a large list of subgroups
Thanks
Manj