There are many ways to modify the graphs that SAS creates. Standard graph customization methods include template modification (which most people use to modify graphs that analytical procedures produce) and SG annotation (which most people use to modify graphs that procedures such as PROC SGPLOT produce). However, you can also use SG annotation to modify graphs that analytical procedures produce. Graphs are constructed from a matrix of information (the ODS data object), layout instructions (a graph template), instructions for the overall appearance (a style template), and dynamic variables. Procedures create dynamic variables to send values (that only become known at procedure run time) to graph templates. These values include statistics, variable names, variable labels, and so on. You cannot fully create, re-create or modify a graph without all four components. On July 31, I wrote about how you can create graphs by using ODS Graphics and then modify the dynamic variables and display the results by using PROC DOCUMENT. Today, I will show you how to capture dynamic variables, modify them, and create a modified graph by using PROC SGRENDER instead of PROC DOCUMENT. This approach enables you to use SG annotation to modify graphs that analytical procedures create.
Let's begin by running PROC REG, displaying the diagnostics panel, and outputting the data object to a SAS data set:
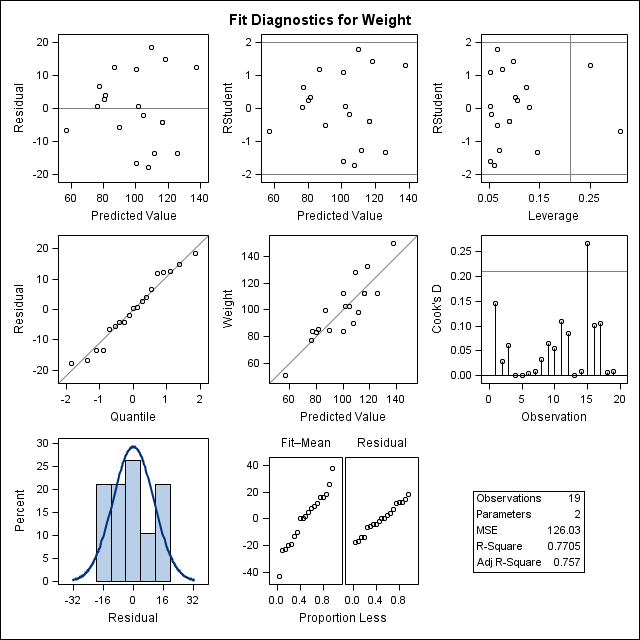
ods graphics on; proc reg data=sashelp.class; ods select diagnosticspanel; ods output diagnosticspanel=dp; model weight = height; quit; |
Click on graphs to enlarge.
You might consider a naive approach to re-creating the diagnostics panel from the data object and the graph template by using PROC SGRENDER as follows:
proc sgrender data=dp template=Stat.REG.Graphics.DiagnosticsPanel; run; |
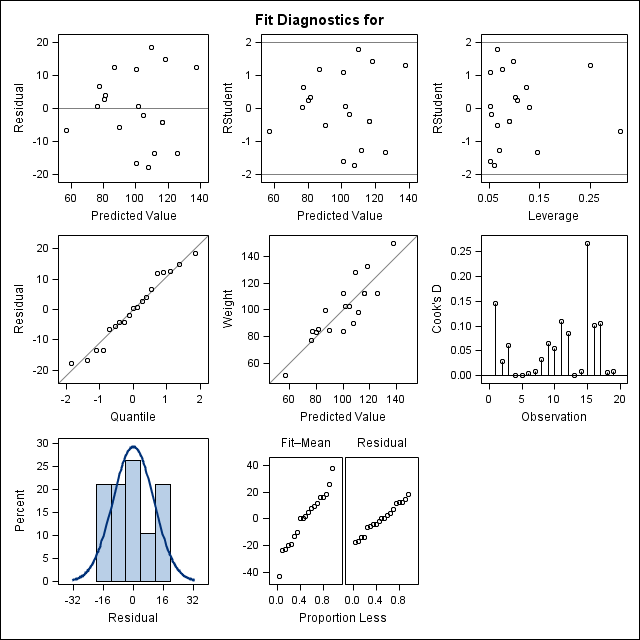
For some graphs, this might completely work (if there are no dynamic variables) or it might completely fail (for example, if there is one graph statement and a critical part depends on dynamic variables). The preceding step partially works. In this example, the statistics table is completely missing, part of the title is missing, and some reference lines are missing.
You can run the following step to create the graph, output the data object to a SAS data set, and capture the dynamic variables in an ODS document.
ods document name=MyDoc (write); proc reg data=sashelp.class; ods select diagnosticspanel; ods output diagnosticspanel=dp; model weight = height; quit; ods document close; |
You can list the contents of the ODS document as follows:
proc document name=MyDoc; list / levels=all; quit; |
You can store the names of the dynamic variables and their values in a SAS data set as follows:
proc document name=MyDoc; ods output dynamics=outdynam; obdynam \Reg#1\MODEL1#1\ObswiseStats#1\Weight#1\DiagnosticPlots#1\DiagnosticsPanel#1; quit; |
The path on the OBDYNAM statement is copied from the listing of the contents of the ODS document.
The next several steps process both the data set of dynamic variables and the graph template so that a subsequent PROC SGRENDER step can re-create the graph. Before I show you those steps, I need to explain the syntax for dynamic variables. Graph templates that procedures use often have a DYNAMIC statement that lists dynamic variables. Graph templates that you write can use dynamic variables, but they can also get dynamic information through macro variables. You can use an MVAR statement to provide character macro variables, and you can use an NMVAR statement to provide macro variables whose values are processed as numbers. The next steps process the dynamic variables and their values, output them to macro variables, and modify the graph template to use MVAR and NMVAR statements instead of a DYNAMIC statement.
The following step preprocesses the data set of dynamic variables:
data dynamics; length label1 $ 32; set outdynam; label1 = upcase(label1); if label1 ne '___NOBS___'; run; |
Variable names are upper cased, and the automatic dynamic variables that contain the number of observations in the data object columns are discarded.
The following step writes the graph template to a file:
proc template; source Stat.REG.Graphics.DiagnosticsPanel / file='temp.tmp'; quit; |
If you need to do ad hoc template modifications, you can do them before you perform the preceding step or build them into the subsequent DATA step that processes the template.
The following step reads the file that contains the graph template, identifies the beginning of the DYNAMIC statement, and extracts the names of all of the dynamic variables:
data d(keep=label1);
   infile 'temp.tmp';
   input;
   length label1 $ 32;
   if _infile_ =: '   dynamic ' then do;
      d + 1;
      substr(_infile_, 1, 10) = ' ';
      end;
   if d then do;
      do i = 1 to 128 until(label1 eq ' ');
         label1 = upcase(scan(_infile_, i, ' ;'));
         if label1 ne ' ' then output;
         end;
      end;
   if d and index(_infile_, ';') then stop;
run; |
This step stops when it hits the semicolon at the end of the DYNAMIC statement.
The following steps sort the two lists of dynamic variables so that they can be merged:
proc sort data=dynamics; by label1; run; proc sort data=d; by label1; run; |
The following step merges the two dynamic variable lists and sets missing character values to ordinary blank missing:
data dynamics(drop=label2 cvalue2 nvalue2); merge d dynamics; by label1; if nmiss(nvalue1) and cvalue1 = '.' then cvalue1 = ' '; run; |
The following step reads the template file again and modifies it:
data _null_;
   infile 'temp.tmp';
   input;
   if _n_ = 1 then call execute('proc template;');
   if _infile_ =: '   dynamic ' then do;
      substr(_infile_, 1, 10) = '*';
      do i = 1 to ndynam;
         set dynamics point=i nobs=ndynam;
         call execute(catx(' ', ifc(n(nvalue1), 'nmvar', 'mvar'), label1, ';'));
         end;
      end;
   call execute(_infile_);
   if _infile_ =: '   BeginGraph' then bg + 1;
   if bg and index(_infile_, ';') then do;
      bg = 0;
      call execute('annotate;');
   end;
run; |
This step uses CALL EXECUTE to submit a PROC TEMPLATE statement, convert the DYNAMIC statement to a comment, submit an unmodified version of every other template statement, add an ANNOTATE statement after the BEGINGRAPH statement (to enable subsequent SG annotation), and submit a series of NMVAR and MVAR statements. There are various ways to annotate by using GTL. This is the simplest, and it enables you to to use annotate coordinates in graph percentage units. See the SG Annotation documentation for other options. The following step is not necessary, but it shows the modified template:
proc template; source Stat.REG.Graphics.DiagnosticsPanel; quit; |
The following step creates all of the macro variables that the NMVAR and MVAR statements need:
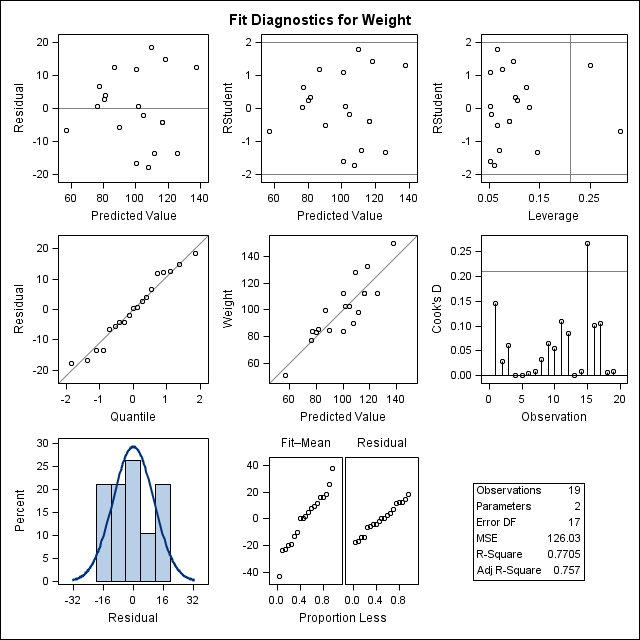
data _null_; set dynamics; if label1 = '_SHOWEDF' then cvalue1 = '0'; call symputx(label1, cvalue1); run; |
This step also modifies one of the dynamic variables. It sets _SHOWEDF to 0 to suppress the display of the error degrees of freedom in the statistics table. (You can instead do this directly in PROC REG.) The following steps create the diagnostics panel from the data set made from the data object, the modified graph template, and all of the dynamic variables (now stored in macro variables):
proc sgrender data=dp template=Stat.REG.Graphics.DiagnosticsPanel; run; |
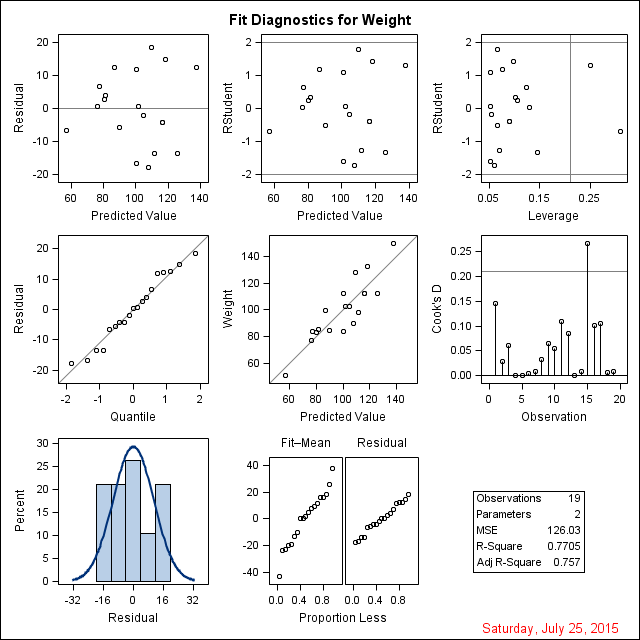
Now you can use SG annotation to modify the graph. This is illustrated in two simple examples. The first example adds a date to the bottom right corner of the graph:
data anno;
   Function = 'Text'; Label = 'Saturday, July 25, 2015';
   Width = 100;    x1 = 99;    y1 = .1;    Anchor = 'Right';    TextColor = 'Red';
run;

proc sgrender data=dp sganno=anno
              template=Stat.REG.Graphics.DiagnosticsPanel;
run; |
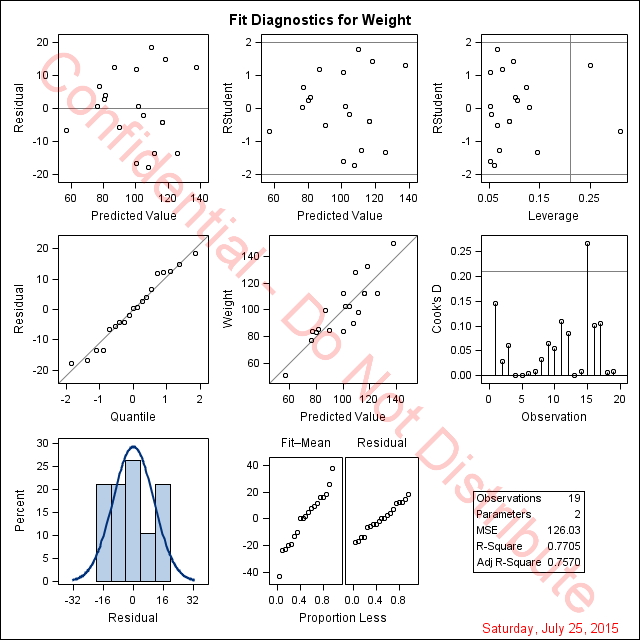
The second example also adds a watermark across the graph:
data anno;
   length Label $ 40;
   Function = 'Text';     Label     = 'Saturday, July 25, 2015';
   Width    = 100;        x1        = 99;   y1 = .1;
   Anchor   = 'Right';    TextColor = 'Red';
   output;

   Label = 'Confidential - Do Not Distribute';
   Width = 150;           x1        = 50;   y1     =  50;   Anchor = 'Center';
   Transparency = 0.8;    TextSize  = 40;   Rotate = -45;
   output;
run;

proc sgrender data=dp sganno=anno
              template=Stat.REG.Graphics.DiagnosticsPanel;
run; |

For more information, see the SG Annotation documentation.
Like most things in SAS, there is more than one way to approach a problem. The following step combines all of the steps above that follow the creation of the OUTDYNAM data set (except the annotate data set creation step). The first step adds the ANNOTATE statement to the template:
data _null_;
   infile 'temp.tmp';
   input;
   if _n_ = 1 then call execute('proc template;');
   call execute(_infile_);
   if _infile_ =: '   BeginGraph' then bg + 1;
   if bg and index(_infile_, ';') then do;
      bg = 0;
      call execute('annotate;');
   end;
run; |
Other than that, the template is not modified. The following step generates and runs the PROC SGRENDER step:
data _null_;
   set outdynam(where=(label1 ne '___NOBS___')) end=eof;
   if nmiss(nvalue1) and cvalue1 = '.' then cvalue1 = ' ';
   if _n_ = 1 then do;
      call execute('proc sgrender data=dp sganno=anno');
      call execute('template=Stat.REG.Graphics.DiagnosticsPanel;');
      call execute('dynamic');
   end;
   if label1 = '_SHOWEDF' then cvalue1 = '0';
   if cvalue1 ne ' ' then do;
      call execute(catx(' ', label1, '=',
                   ifc(n(nvalue1), cvalue1, quote(trim(cvalue1)))));
   end;
   if eof then call execute('; run;');
run; |
The results match the previous graph. Instead of processing two lists of dynamic variables, this step runs PROC SGRENDER along with a customized DYNAMIC statement that populates the dynamic variables with values. This approach has the advantage of requiring less code. However, the final PROC SGRENDER step is entangled with the processing of dynamic variables. You might prefer to process the dynamic variables and then have a simple PROC SGRENDER step you can run each time that you want to try a new modification of the graph. Either way, SAS provides you the flexibility that you need to modify a graph.
One final example modifies the graph template as well to provide the same formatting for the R square and the adjusted R square:
data _null_;
   infile 'temp.tmp';
   input;
   if _n_ = 1 then call execute('proc template;');

   i = index(_infile_, 'BEST6.');
   if i and (index(_infile_, '_ADJRSQ') or index(_infile_, '_RSQUARE'))
      then substr(_infile_, i, 6) = '6.4';

   call execute(_infile_);
   if _infile_ =: '   BeginGraph' then bg + 1;
   if bg and index(_infile_, ';') then do;
      bg = 0;
      call execute('annotate;');
   end;
run;

data _null_;
   set outdynam(where=(label1 ne '___NOBS___')) end=eof;
   if nmiss(nvalue1) and cvalue1 = '.' then cvalue1 = ' ';
   if _n_ = 1 then do;
      call execute('proc sgrender data=dp sganno=anno');
      call execute('template=Stat.REG.Graphics.DiagnosticsPanel;');
      call execute('dynamic');
   end;
   if label1 = '_SHOWEDF' then cvalue1 = '0';
   if cvalue1 ne ' ' then
      call execute(catx(' ', label1, '=',
                   ifc(n(nvalue1), cvalue1, quote(trim(cvalue1)))));
   if eof then call execute('; run;');
run; |
The first step uses an IF statement to change the BEST6. format to a 6.4 format for the R square and the adjusted R square. Of course you do not need to modify templates in a DATA step, but this template is so large that it is hard to show other ways to change it.
The following step deletes the modified template:
proc template; delete Stat.REG.Graphics.DiagnosticsPanel; quit; |
In summary, you can capture graphs that analytical procedures create, modify the graph template, modify the dynamic variables, and perform additional modifications by using SG annotation.
Click here for a full example that uses a macro to automate most of the steps.
For more information:
SG Annotation
ANNOTATE Statement
Graph Template Language
CALL EXECUTE


3 Comments
Looks like some very useful tips, here!
Pingback: Annotating multiple panels - Graphically Speaking
Pingback: Reorder the output from a BY-group analysis in SAS - The DO Loop