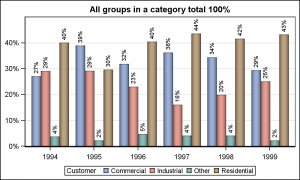
The GCHART procedure has a popular option called G100 to display all the subgroups in % format such that all the subgroup values add up to 100% for each group. Each subgroup is labeled with its own % values.
SGPLOT procedure does not such an option, but with a little bit of preprocessing of the data, similar results can be obtained, with the added benefit that the groups can be stacked or clustered. Here, my interpretation of G100 is that all groups within a category add up to 100 %.
I want to draw a G100 graph of Revenue by Year with Group=Customer. First, I run the MEANS procedure on the sashelp.electric data set to compute the revenues by year and customer. I retaining all observations with _TYPE_ of 2 or higher, and the sort the data by year and customer.
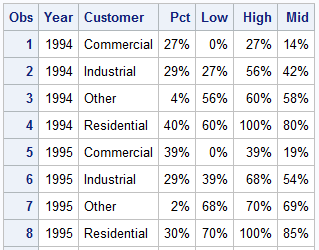
Note, in the data set above sorted by Year and Customer, the total revenue for all customers for each year (_type_ = 2) comes before the detailed values per customer (_type_ = 3). So, I simply run a data step to divide out all individual customer values for each year by the total to obtain the fraction for each customer per year. I set the percent format on the values and drop the total value to get the data set below that I want.
We want to label each stacked bar segment by the value. SGPLOT VBAR does not label all segments, so we will compute the low and high values for each customer segment within year. Then, I can use the High Low plot to draw the bars segments, and overlay the labels using a scatter plot. See attached code for the details.
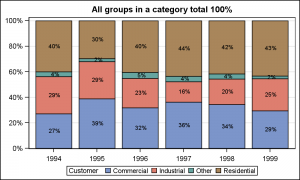
SAS 9.3 SGPLOT G100 stacked (click on graph for high resolution image):
SAS 9.3SGPLOT code for G100 stacked:
title 'All groups in a category total 100%'; proc sgplot data=pctByYearDescending(where=(year < 2000)); highlow x=year low=low high=high / type=bar group=customer; scatter x=year y=mid / markerchar=pct markercharattrs=(color=black size=7); yaxis grid display=(nolabel) offsetmin=0; xaxis display=(nolabel); run; |
The Year, Low and High are used to draw each segment of the stacked bar. These are overlaid with the scatter plot using Markerchar at (year, mid).
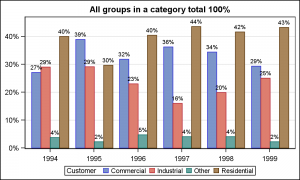
With this data, the same graph can also be plotted as cluster groups. Cluster groups with a data label for each group is easy to do with SGPLOT, so, we'll use the VBAR statement to do that. I did not set the Y axis max to 100%, but you can if you wish.
SAS 9.3 SGPLOT G100 cluster (click on graph for high resolution image)::
SAS 9.3 SGPLOT code for G100 cluster:
title 'All groups in a category total 100%'; proc sgplot data=pctByYearDescending(where=(year < 2000)); vbar year / response=pct group=customer groupdisplay=cluster grouporder=data nostatlabel datalabel datalabelattrs=(size=7); yaxis grid display=(nolabel); xaxis display=(nolabel); run; |
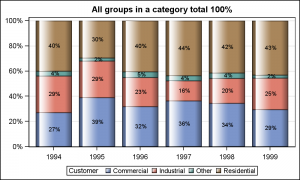
With SAS 9.4, there are some improvements in the graph drawing. High Low plot can have data skins and the numeric labels on the bar charts will rotate when needed. Here are the same graphs created using SAS 9.4:
Full SAS9.3 code for G100 Graphs: G100_93
Full SAS9.4 code for G100 Graphs: G100_94



9 Comments
Pingback: Construct a stacked bar chart in SAS where each bar equals 100% - The DO Loop
The pctlevel=group option also does this.
R
could you tell me how to remove the surrounding line of SAS graph or chart frame? When we copy and paste these graph and chart, I don't want the frame line to be displayed. Many thanks!
For SGPLOT graph, sse NOBORDER on the procedure statement to remove the border around the data. Use NOBORDER on the ODS Graphics statement to remove the outermost graph border.
In 9.4, is there a way to NOT have the numeric labels on the bar charts rotate?
Answered my own question. Shrink the font size.
You can use the DATALABELFITPOLICY=none to avoid rotation. The labels may overlap with neighboring labels.
How to generate dataset pctByYearDescending? Is it not shown here?
The code for that is in the 9.3 and 9.4 code links at the bottom of the post.