A commonly requested graph is a bar chart with response and targets. With SAS 9.3, the SGPLOT procedure supports new "parametric" plot statements called HBARPARM and VBARPARM. These statements are special versions of the HBAR and VBAR statements and they expect summarized data for each category or category+group combination. Also, the HBARPARM and VBARPARM are basic plot statements, and thus they can be used along with other basic plot types like scatter, series, etc.
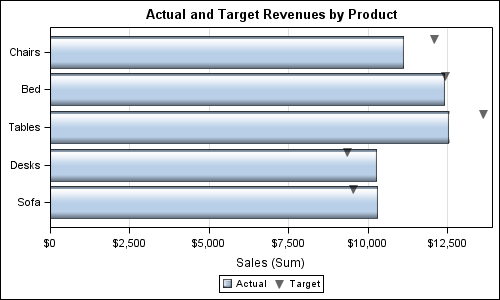
A targeted bar chart can be built by overlaying a parametric bar chart with a scatter plot. Note, the data has to be summarized by you prior to use in the HBARPARM statement. Here is the resulting graph along with the SGPLOT code.
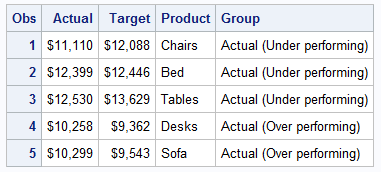
The data used for this graph is as shown here:
SAS 9.3 SGPLOT Code:
title 'Actual and Target Revenues by Product'; proc sgplot data=revenues noautolegend dattrmap=attrmap; hbarparm category=product response=actual / dataskin=gloss name='a'; scatter y=product x=target / markerattrs=(symbol=triangleDownFilled size=10) name='t' legendlabel='Target' discreteoffset=-0.35 transparency=0.4; xaxis offsetmin=0 label='Sales (Sum)' grid; yaxis display=(nolabel); keylegend 'a' 't' / title=''; run; |
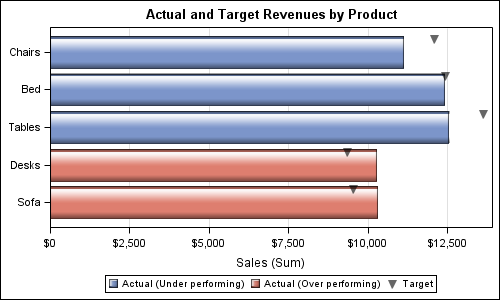
In the data set shown above, we have computed group values as "Over performing" or not based on whether the Actual revenue exceeds the Target. Let us use this column to color the bars. Here is the graph and the code:
SAS 9.3 SGPLOT code:
title 'Actual and Target Revenues by Product'; proc sgplot data=revenues noautolegend dattrmap=attrmap; hbarparm category=product response=actual / dataskin=gloss group=group name='a'; scatter y=product x=target / markerattrs=(symbol=triangleDownFilled size=10) name='t' legendlabel='Target' discreteoffset=-0.35 transparency=0.4; xaxis offsetmin=0 label='Sales (Sum)' grid; yaxis display=(nolabel); keylegend 'a' 't' / title=''; run; |
Note in the above graph, the bars are colored using the style elements GraphData1 and GraphData2. GraphData1 is used for the first group value encountered by the program, which happens to be "Actual (Under performing)". This group value gets the color from GraphData1, which is blue. The other group gets the 2nd graph data style element, with the color red.
In this case this does NOT work very well since the over performing products get the red color. We could change the color assignment for the graph data elements in the style, but there is no way to ensure the correct value is encountered first in the data.
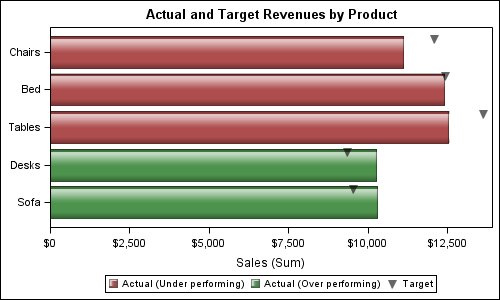
The right way to address this issue is to use the Discrete Attribute Map feature supported by the SAS 9.3 SGPLOT procedure. In this feature, you can define the list of group values you expect in the data, and the visual attributes (such as fill color, marker symbol, etc.) for each value. Since the visual attributes are used based on group value, not position in the data set, the results are predictable. Here is the graph and code using an attribute map:
SAS 9.3 SGPLOT code:
/*--define discrete attributes map data set--*/ data attrmap; length value $25; ID='A'; value='Actual (Over performing)'; fillcolor='darkgreen'; output; ID='A'; value='Actual (Under performing)'; fillcolor='darkred'; output; run; /*--SAS 9.3 SG Grouped Horizontal Target Bar Chart with Attr Map--*/ ods graphics / reset width=5in height=3in imagename='TargetAttrmap_SG'; title 'Actual and Target Revenues by Product'; proc sgplot data=revenues noautolegend dattrmap=attrmap; hbarparm category=product response=actual / dataskin=gloss group=group attrid=A name='a' transparency=0.3; scatter y=product x=target / markerattrs=(symbol=triangleDownFilled size=10) name='t' legendlabel='Target' discreteoffset=-0.35 transparency=0.4; xaxis offsetmin=0 label='Sales (Sum)'; yaxis display=(nolabel); keylegend 'a' 't'/ title=''; run; |
Full SAS 9.3 SGPLOT program: BarTarget_SG


4 Comments
Cool!
Personally, I am a big fan of Cleveland dot plots rather than bar charts. Two reasons: 1) They let you plot more data on one page 2) They represent one dimensional data as one dimension, rather than two.
I know bar charts are a lot more popular though.
Could the same methods used in this example be used with dotplots?
Certainly other representations are possible. A bar with a target line or a needle with a target marker could work well too. The Discrete Attributes Map will work with anything, and can ensure the correct attributes (color, symbol, etc.) are used based on group value regardless of their position (or presence) in the data.
how would I apply this type of approach through GTL and SGRENDER?
You should be able to apply exactly the same approach with GTL. The syntax may be a bit different, as the attribute map can be built right into the GTL template itself, using the DISCRETEATTRMAP statement.