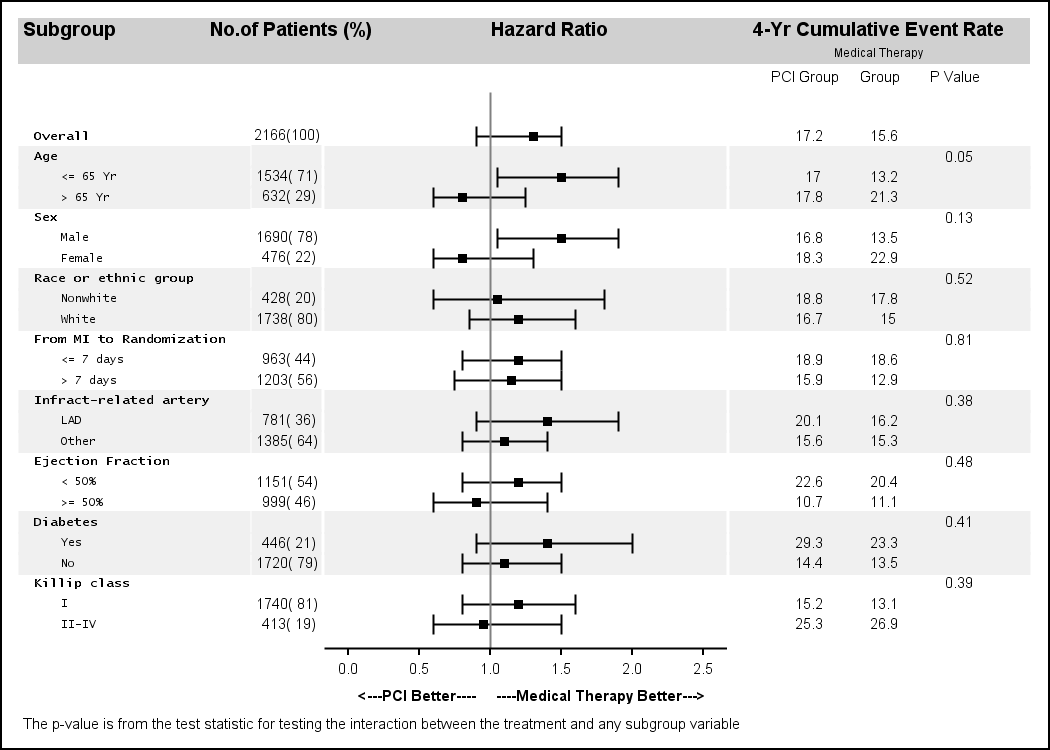
Just a few days ago our "super-duper tech support trooper" called in asking for the link to the subgrouped Forest Plot with bold headings. She was referring to this Forest Plot with Subgroups I had posted earlier. However, as you can see, while the subgroup values are indented from the subgroup headers, the headers do not have bold fonts.
Well, I happily informed her that we had anticipated just such a need, and we have built into SAS 9.4 a new statement (AXISTABLE) which will make subgroup indentations and font attribute control much easier. Surprisingly, she was not as impressed with this information as I had thought, asking instead "What can you do for me now?". Some people are so hard to please...
I promised her I will take another look, and so I did. Looking back over the code for the graph, we see that both the subgroup headers and values are in the same column drawn by one scatter plot statement. So they all can have only one setting for text attributes.
This led to the idea that if we want the headings to have bold attributes, they will need to be in a separate column from the values. Then, we can use two separate scatter plot statements to overlay the strings with different text attributes. Of course, only one of these two columns will have a non-missing string per observation.
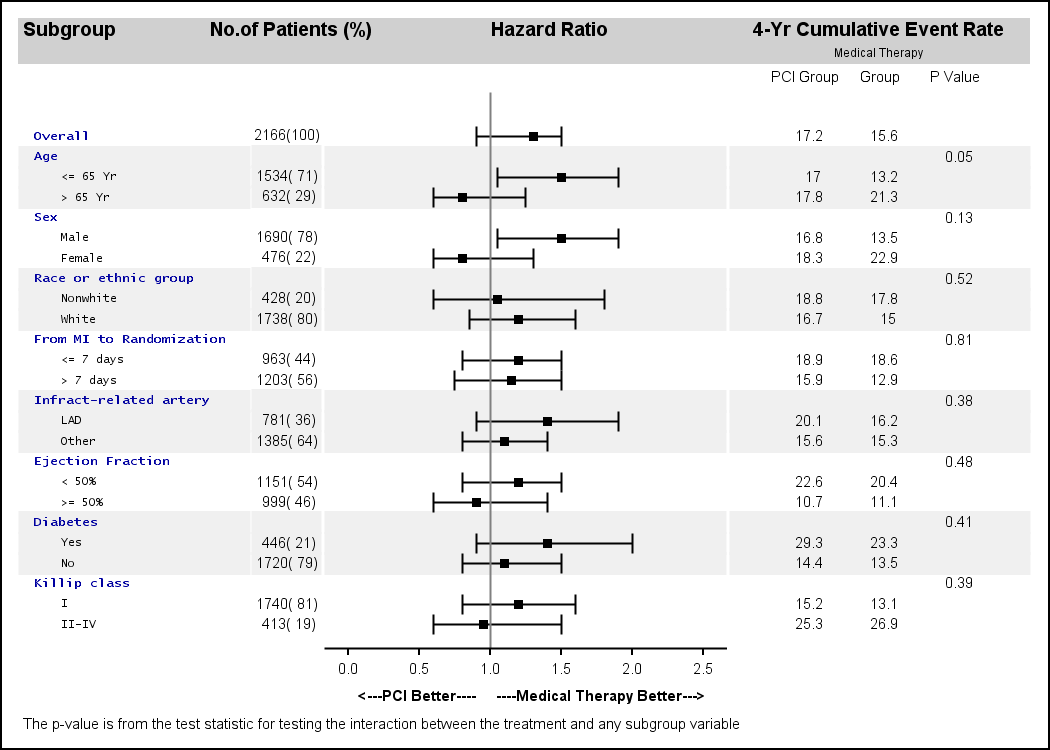
Here is the result. Click on graph to see bigger version:
Here is the GTL code snippet that makes this possible:
scatterplot y=obsid x=zero / markercharacter=subgroup markercharacterattrs=(family='Lucida Console' size=6); scatterplot y=obsid x=zero / markercharacter=heading markercharacterattrs=(family='Lucida Console' size=6 weight=bold); |
Note, in the code above, the second scatter plot uses MARKERCHARACTER=HEADING and WEIGHT=BOLD. The full code is attached at the end of the post.
Could we also make the font for the headings bigger? Unfortunately, not with this technique as that will cause the two strings to be misaligned. But, it is possible to change the color of the headers to provide a bit more of a distinction:
One other possibility is to use the "ID" column as a group variable for the single scatter plot statement, thus causing the headers and values to be drawn using two group attributes. The results are less than satisfactory.
These kind of "creative" usage of the plot statements to draw text strings that are aligned with plot data in the graph led to development of the new AXISTABLE statement for SAS 9.4. This statement is designed to make such graphs easier. We are very excited with the possibilities that this statement opens up and we will write up many articles using AXISTABLE as we get closer to the release date for SAS 9.4.
Full SAS 9.2 Program: ForestPlot_92


4 Comments
Pingback: Forest Plot
Pingback: GTL Layouts - Graphically Speaking
How can we display the forest plot in the 2 pages , for example if we have 20 observations that will not fit in the one page. i want to display it in 2 pages and for subgroup column how can we display 10^9...
What if two or more subgroups (e.g., Diabetes and Heart Failure at Baseline) have the same responses Yes/No. If we use a Y= statement, the second subgroup containing Yes/No values does not display those responses.