At SAS Global Forum, and again at PharmaSUG, we had the pleasure of attending many papers and presentations on various topics that included graphs in the power point decks or in the papers. More often than not, the graphs exist along other text, and occupy a smaller part of the screen or page. These presentations include graphs created by ODS graphics, either as automatic graphs from Base and STAT procedures, or by SG procedures.
Often, the natural inclination is to fit the default sized graphs created by the procedure into a smaller space in the presentation. All graphs (with very few exceptions) created by ODS Graphics have a size of 640 x 480 pixels. This is the same as 6.66 x 5 inches at the default 96 dpi. When a graph like this is inserted into a smaller space in a Powerpoint slide or in one column of a Word doc, the graph is shrunk to fit the space. In such cases, a default size graph would look like this:
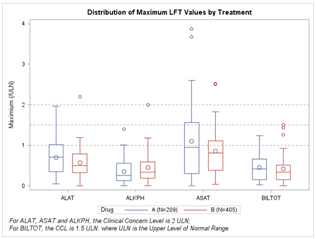
The above graph is captured from the screen from a Word document. When a 6.66 inch wide graph is shrunk to fit a 3.25 in wide space, everything is scaled down by a factor of (3.25 / 6.66) = 0.488. As we can see, all the elements of the graph are scaled down, including the text so an 8pt. font is now displayed effectively at 4pt. which is quite unreadable to many eyes. A similar effect is can also be seen to varying degrees in various papers presented at SAS Global Forum 2012.
My solution is to render the graph at its expected size on the page using a high dpi. In a two column document, each column is about 3.25 inches. So, I render the graph with a width of 3.25 inches at 300 dpi. When this graph is inserted into a 3.25 wide region, we get this:
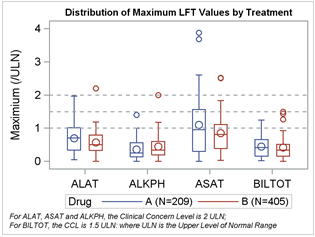
Here are the options you need to get this :
ods listing image_dpi=300;
ods graphics / width=3.25in;
As you can see, now the graph fits "as is" in the space, and the text elements are clearly readable. This effect is by design, and not by accident. Internally, the default "design" size of all ODS Graphs is 640 x 480 pixels. At the default dpi of 96, this translates to a graph of about 6.66 x 5 inches. However, when this graph is rendered at a smaller "render" size of 3.25 inches, all elements of the graph are scaled by a non-linear factor = (3.25 / 6.66) ** 0.25 = 0.83. This is done by the procedure, so now the 8pt font is rendered at about 6.6pt, which is much more readable. The DPI value of the image is inserted into the PNG file, so Powerpoint and Word know how to display the image correctly.
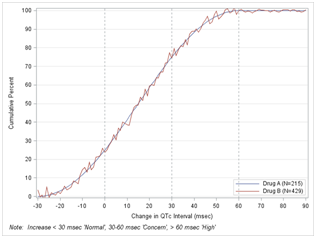
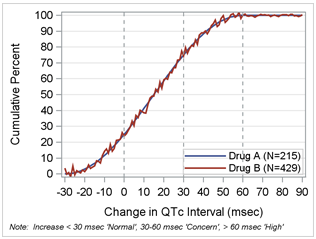
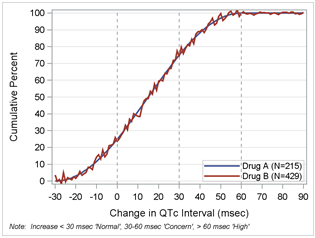
Here is another example of a QTc graph, inserted into a 3.25 inch wide space, with a graph rendered using default settings, and another graph rendered with a width of 3.25 inches at 300 dpi.
Default rendering:
Rendered with width=3.25in and 300 dpi:
Note: There are two types of scaling going on in this situation.
- Linear image scaling is done by Word to fit an image into the space available.
- Non linear graph scaling is done by ODS to render a design-size graph into render-size image.
In the examples above, the 1st case uses only image scaling to squeeze a 6.66 inch graph into a 3.25 inch space. In the 2nd case, we use only graph scaling as we rendered the graph to the right width of 3.25 inches, so no image scaling was applied.
Sometimes, when a graph is very busy, using a width of 3.25 inches can make the fonts relatively too big. You can use a combination of the image scaling and graph scaling to achieve an intermediate result. If you render the graph to a width of 4 inches, and then add it to a 3.25 inch space in the doc, here is what you get:
A 4 in wide graph at 300 dpi in 3.25 inch space:
In this case the font sizes are somewhere between the first two examples, and imho, well balanced. You can use this technique to fine tune the graph for maximum quality and readability. These graphs are rendered using SAS 9.3, but this scaling technique also applies to SAS 9.2 graphs.
Full SAS code: Graph_Size_SAS93


13 Comments
I know you can say
ODSGRAPHICS / RESET;
to restore the default width. Is there a similar RESET statement to restore the default DPI?
I know of no option on the ODS destination statement to reset the DPI. You can set it again to a known default, or close and reopen the destination.
Nice tip! Thanks Sanjay!
Kriss
Why is the image_dpi expressed on the ODS LISTING statement, and not on, say, a GDEVICE statement or on another ODS statement? I think of LISTING as being mono-spaced output,
I'll definitely check these techniques out as soon as I can!
Yes, the LISTING destination creates simple text table output, and also individual graphs that can be accessed as PNG image files. ODS graphics does not use GDEVICE or GOPTIONS.
The IMAGE_DPI= option is not limited only to the LISTING destination, is it?
I have always assumed that you can use it for any destination though it may not make sense for some destinations (such as HTML which is designed for computer screens).
Why do we put the IMAGE_DPI= option in an ODS destination statement instead of an ODS GRAPHICS statement?
I think this is one of the reasons that specifying dpi confusing.
Only some destinations allow setting of Image_Dpi so it makes sense there. Putting it on the ODS Graphics statement will mean it will only work sometimes. Also, for individual graph output, where you want access to the image to insert in a Word doc or Powerpoint slide, I normally use LISTING.
If I create an image at 300 dpi, bring it into Word and resize it, is it still 300 dpi?
If not, is there any way to know what the dpi is?
Thanks for a very helpful post!
When I create a graph with Width=4in at 100 dpi and view the png image in an image viewer, it will show up with width=400pixels. If I import it into Word, it occupies about 4" space in the doc the properties will show 4" size at 100%. If I use a DPI of 300 and view the png image in an image viewer, it will show up with width=1200pixels but the graph still occupies only 4" in the Word doc and the result is nicer. That is how I can tell. I hope there is a better way. 🙂
Hi Sanjay :
It's a good tip.
But in the world of science, journals, book production normally all pictures or graphs are required in a vector format, say eps or in recent years pdf (an old one was emf). Could you comment on how a SAS user should optimize his/her settings for graph-type pdf which he/she urgently needs for a LaTeX book production ? Being vector you would not expect to use dpi.
A colleague of yours told me that vector-graphics would be enabled for all ODS-statistical graphics type graphs from SAS 9.3 on. Is this true or being delayed ?
Yes, vector graphics are used by default for PDF, PS and EMF output with SAS 9.3, except for the few exceptions. EMF does not support transparent objects, and PDF has problems with gradient shading. In such cases, the file may still contain an image.
With SAS 9.2, I suppose you could create PNG image output with the LISTING destination and include the image into a latex document. I am not knowledgeable about Latex, but here is a link that may provide some info about including PNG files in Latex using "pdflatex" http://en.wikibooks.org/wiki/LaTeX/Importing_Graphics
Thanks for the information about vector graphics. Can all procedures that use ODS GRAPHICS now output to SVG (scalable vector graphics)? These can be embedded in or linked to HTML pages. When viewed through a browser, the user can scale the graphic themselves, which has great advantages, e.g. when looking at large decision trees. SVG is an open standard non-proprietary format, unlike all the others you mention.
Yes, just set the OUTPUTFMT=SVG. However, note that SVG does not support some special features such as Gradient transparency, etc. So, some plots may not render as SVG if they contain the special features. In such cases, a PNG file will be rendered instead. However, this is not likely to happen for most statistical or clinical graphs.