In an earlier blog post my colleague, Suneel Grover, wrote about how to take advantage of the product recommendations technology implemented in SAS Customer Intelligence 360. He noted that two methods are implemented behind the scenes, a visitor-centric and a product (or item)-centric approach. And most importantly,  while some sophisticated analytics and processing are taking place behind the scenes, this is completely automated, and the marketer can concentrate on where, and how, recommendations are used.
My previous post talked about how SAS has developed a hybrid approach to recommendations based on combining product- and visitor-centric methods and how this can help alleviate the cold-start problem associated with recommendation systems. I promised to follow this up with more details on the product-centric approach adopted in SAS Customer Intelligence 360 to prove the claim that our powerful network graph approach used for product-centric recommendations has advantages over the more prevalent association-rule-based methods. This post delivers on those promises by:
- Describing how the network graph approach works.
- Explaining the differences and advantages of the network approach versus association rules.
To recap, recommendations in SAS Customer Intelligence 360 use product or offer views as a proxy for explicit ratings used by traditional recommendation systems. The more that products are viewed by similar users, the stronger the association is between these products (and the users) and the greater the interest.
Product-centric recommendations explained
I think that it’s important to provide a robust explanation of the graph-based method used to generate product centric recommendations. An association is formed when two or more products are viewed in the same session. This association is represented by a link between the items. If those links are repeated in other visitor sessions, then they get reinforced. The idea behind a network graph analysis is to literally draw the connections between all pairs of products and calculate the strength of the links between them.
In addition, the items often form groups, or communities, based on shared similarity characteristics. The degree of closeness of an item to its community members is expressed through a series of similarity metrics. These metrics can also be applied for items in other communities. In business terms, communities might represent up-sell opportunities, but cross-community similarities might represent cross-sell opportunities. However, such simplistic interpretations do not always fit.
Alternative recommendation methods
Association analytics (also known as market-basket analysis) is the most common method used to determine that if product A and product B are viewed, then what other product ought to be shown. A common criticism of association-rule-based techniques is that the algorithms have too many parameters, which result in large rule sets with many off-target combinations. This leads to difficulties in understanding the associations and thus gaining confidence in the system. Because of this and other reasons (read below) SAS sought alternative methods.
SAS arrived at link-graph leads based methods as a candidate because of the idea that a link graph allows us to explore the underlying relationship topography and derive measures that describe the “distance” between products so you can compute similarity. This then helps you find products that have a behavioural similarity, which leads to stronger recommendations than other methods. In summary, the benefits are three-fold:
- Each product belongs to one, and only one, community, hence finding product recommendation is easy while in association multiple rules needs to be parsed to get a set of recommendations (automating this is a challenge).
- Getting a reasonable number of recommendation is easy even for products with relatively weak connections because SAS uses community-to-community connectivity to search for more recommendations.
- Shortest-path and multiple-centrality measures gives good and varied choice for ranking the recommendation.
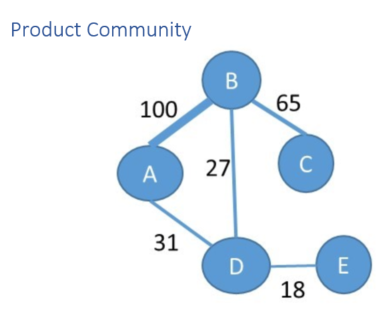
SAS uses common product views as the link to generate undirected graph of the products. The diagram above shows a sample graph based on product views. The numbers on the links between products indicate how many times the products were viewed together (in the specified historical user session data), for example, product A and B were viewed together 100 times.
As a part of analysis, you first create a network of products comprising all products from the product catalogue using the given event information. You then recursively partition this network to smaller product communities. For example, in the figure above, after network decomposition, products A, B and C (highly similar in terms of their views) may belong to one community and products D and E (less similar in terms of their views) may belong to another community. The size of the communities is controlled via graph partitioning algorithm parameters. Full details of the graph analysis algorithm are here.
You then calculate, for each pair of products within a community, the shortest path between them. The idea is that, for product A, you will recommend the n products with the shortest paths to A. The shortest path is calculated using both the direct link weight and inverse link weight. An example of a product community graph is shown below. For simplicity, only direct links have been drawn. The link weight is indicated, and, for any path between two points the distance is the sum of the link weights.
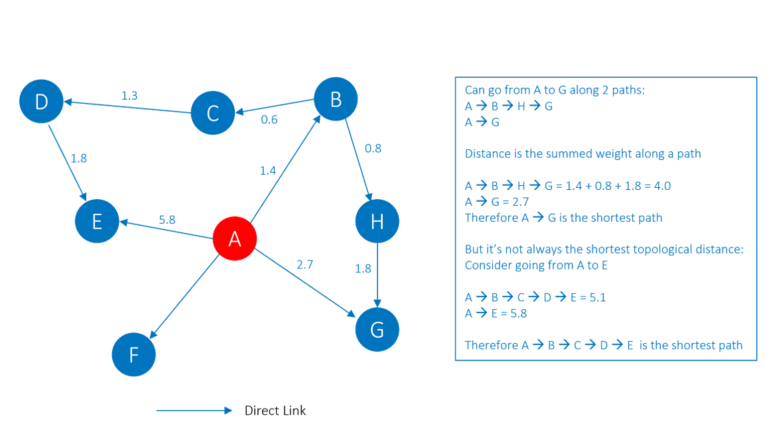
The example calculation above illustrates how the shortest topological path is not always the shortest when using link weights. It is the link weights that contain the strength of connection between products, not the number of steps. Once the final product communities are created, you generate pairwise metrics using shortest path per community. These metrics are used when the recommender is deployed and serve as a decision-making mechanism for sorting and prioritising products.
How good is the network graph approach?
Quantifying the performance of an algorithmic recommendation system is hard, especially when the product catalogue contains many items. The challenge is in setting up test cases, where the input product(s) are known and explicit business rules connect these inputs to expected outputs. All the intelligence is contained in the network links, but the combinatorics make it hard to comprehend.
The optimum approach in this case is to adopt a train/validate strategy, in which a portion of input data is used as a training set, and the remainder as a test or validation set. Once the system has been trained, it is used to predict for an item in the validation set, what other items ought to be selected in the same visit. Measures such as precision and recall provide insight into how well the system is doing by quantifying the relevance of the recommendations.
Precision, which measures what proportion of the total set of recommended products were actually viewed in the validation set, reached as high as 34 percent. This means that one in three recommended products are relevant to the customer. Recall, which measures what proportion of all the future viewed products were recommended, was around 7.5 percent.
This is a good result given the huge number of products typically viewed on a web site and the relatively small size of the recommended product set (typically 10 per visitor). Under these conditions having a recommendation set of 10 products means that, on average, between 3 or 4 are highly relevant.
Summary
SAS Customer Intelligence 360 uses a network-graph-based approach to calculate product-centric recommendations. The method has several advantages over more conventional association analysis methods. These then translate into more accurate recommendations, which means better and more relevant offers for the customer. Stay tuned as we show you how to take advantage of advanced analytic features offered in SAS Customer Intelligence 360.