Every brand offers a digital experience for a reason. But to achieve on your mission, raising awareness and attracting visitors through online media is critical. No visitors? Game over. Let’s dive into a business case using  website visitor data to sas.com. Suppose that a manager asks:
What did our web traffic look like over the last few months?
Digital analysts can easily answer this question using SAS Customer Intelligence 360 in a few clicks using a time series plot.
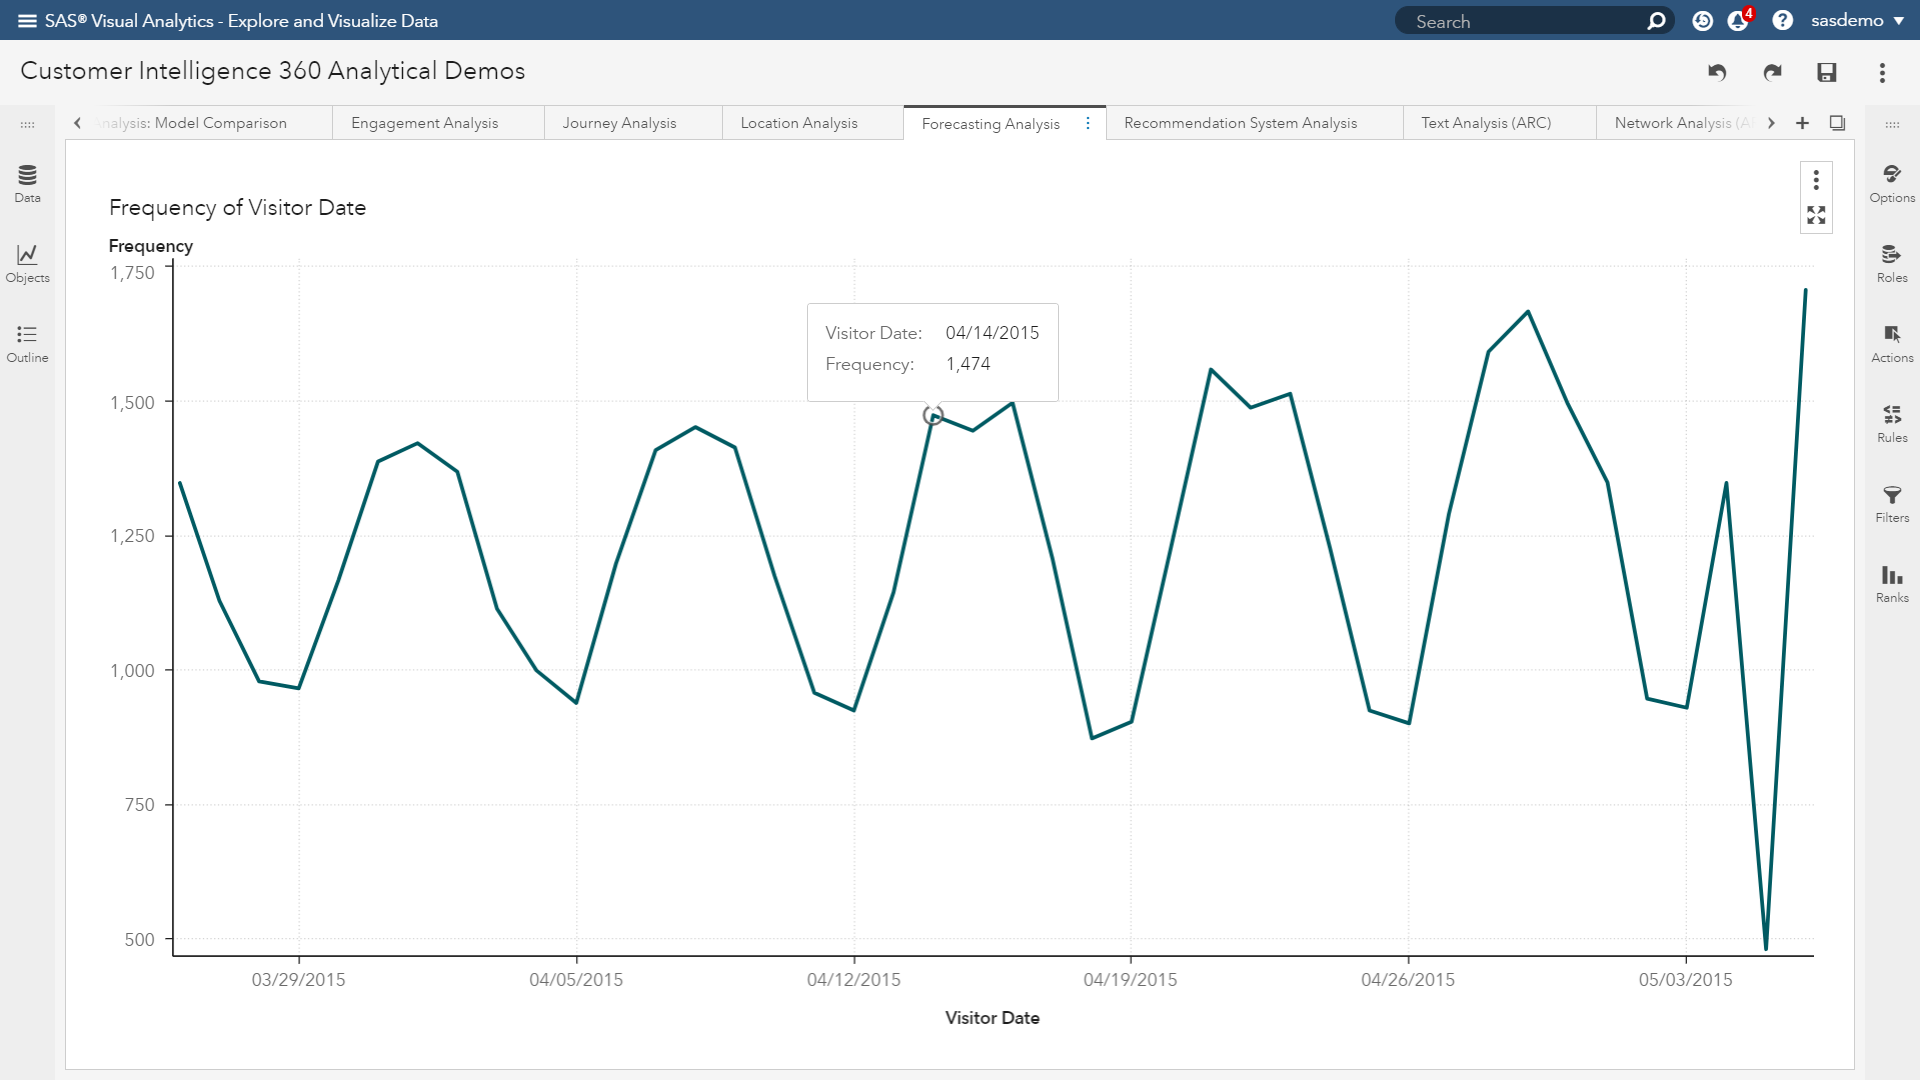
The visualization allows us to answer questions like:
- How much traffic did we receive in this period?
- Which date provided the highest traffic volume?
- Did anything out of the ordinary occur?
All of these questions have one common bond. They ask for answers that look backwards in time. Now suppose your manager asks a new question:
What’s going to happen to web traffic in the next two weeks?
It’s time to transition from moonwalking to taking a predictive view. The question requires the capability to perform analytical forecasting. Within SAS Customer Intelligence 360, users can use a forecasting object to show estimates of future values based on historical (and statistical) trends in the data.
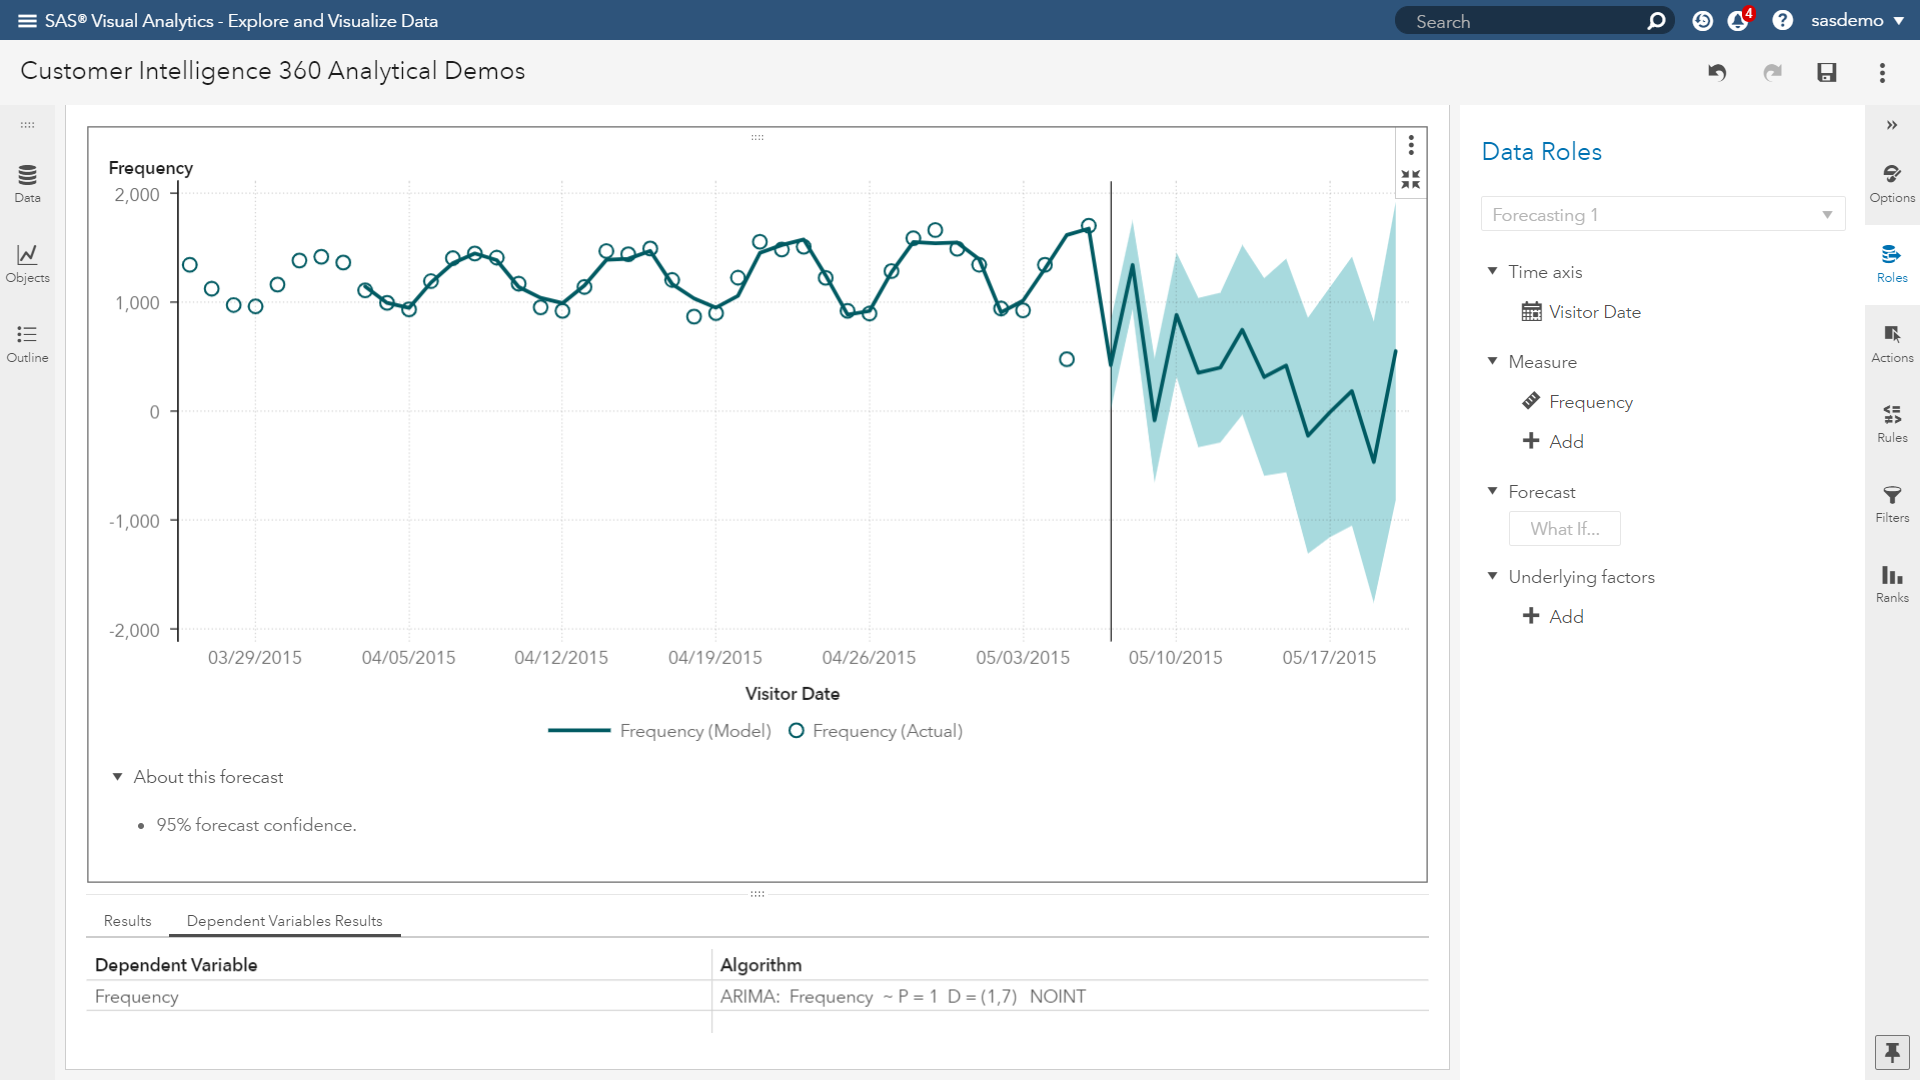
The forecast adds a line with a predicted value and a colored band that represents the confidence interval. But how did we arrive at this result?
Your data is tested against the following forecasting methods and the best one is automatically applied:
- Models for time-series with trend
- Damped-trend exponential smoothing
- Linear exponential smoothing
- Simple exponential smoothing
- Models for time-series with seasonality
- Seasonal exponential smoothing
- Models for time-series with trend and seasonality
- Winters additive exponential method
- Winters multiplicative exponential method
For those of you who care, the RMSE (root mean square error) test is used to determine the best method. Thanks, SAS, but we’re just getting started.
Your manager views this, and then requests:
Is there a way to reduce the variability of the forecast? Can we tighten up the confidence interval?
In other words, management wants to have a tight grip on the best- and worst-case scenarios for the forecasted period. Important decisions need to be made proactively, and risk must be minimized. Welcome to the world of underlying factors, and the ability to add additional measures to contribute to the accuracy of the forecast.
In Figure 2, the forecast is simply based on visits by date. Now we will add more data elements to describe the traffic sources of the visits.
- Paid search: Visits attributed to ad media interactions on search engines, like Google, Bing, and Yahoo.
- Organic search: Visits that originate from search engines without an interaction with ad media.
- Social: Visits from social media platforms, like Facebook, Twitter, or LinkedIn.
- Mobile: Visits tied to mobile app users.
- Email: Visits associated with email campaigns.
- Display: Visits linked to display ad media, such as banners or other ad formats made of text, images, flash, video, and audio.
- Direct: Visits that come directly to the website.
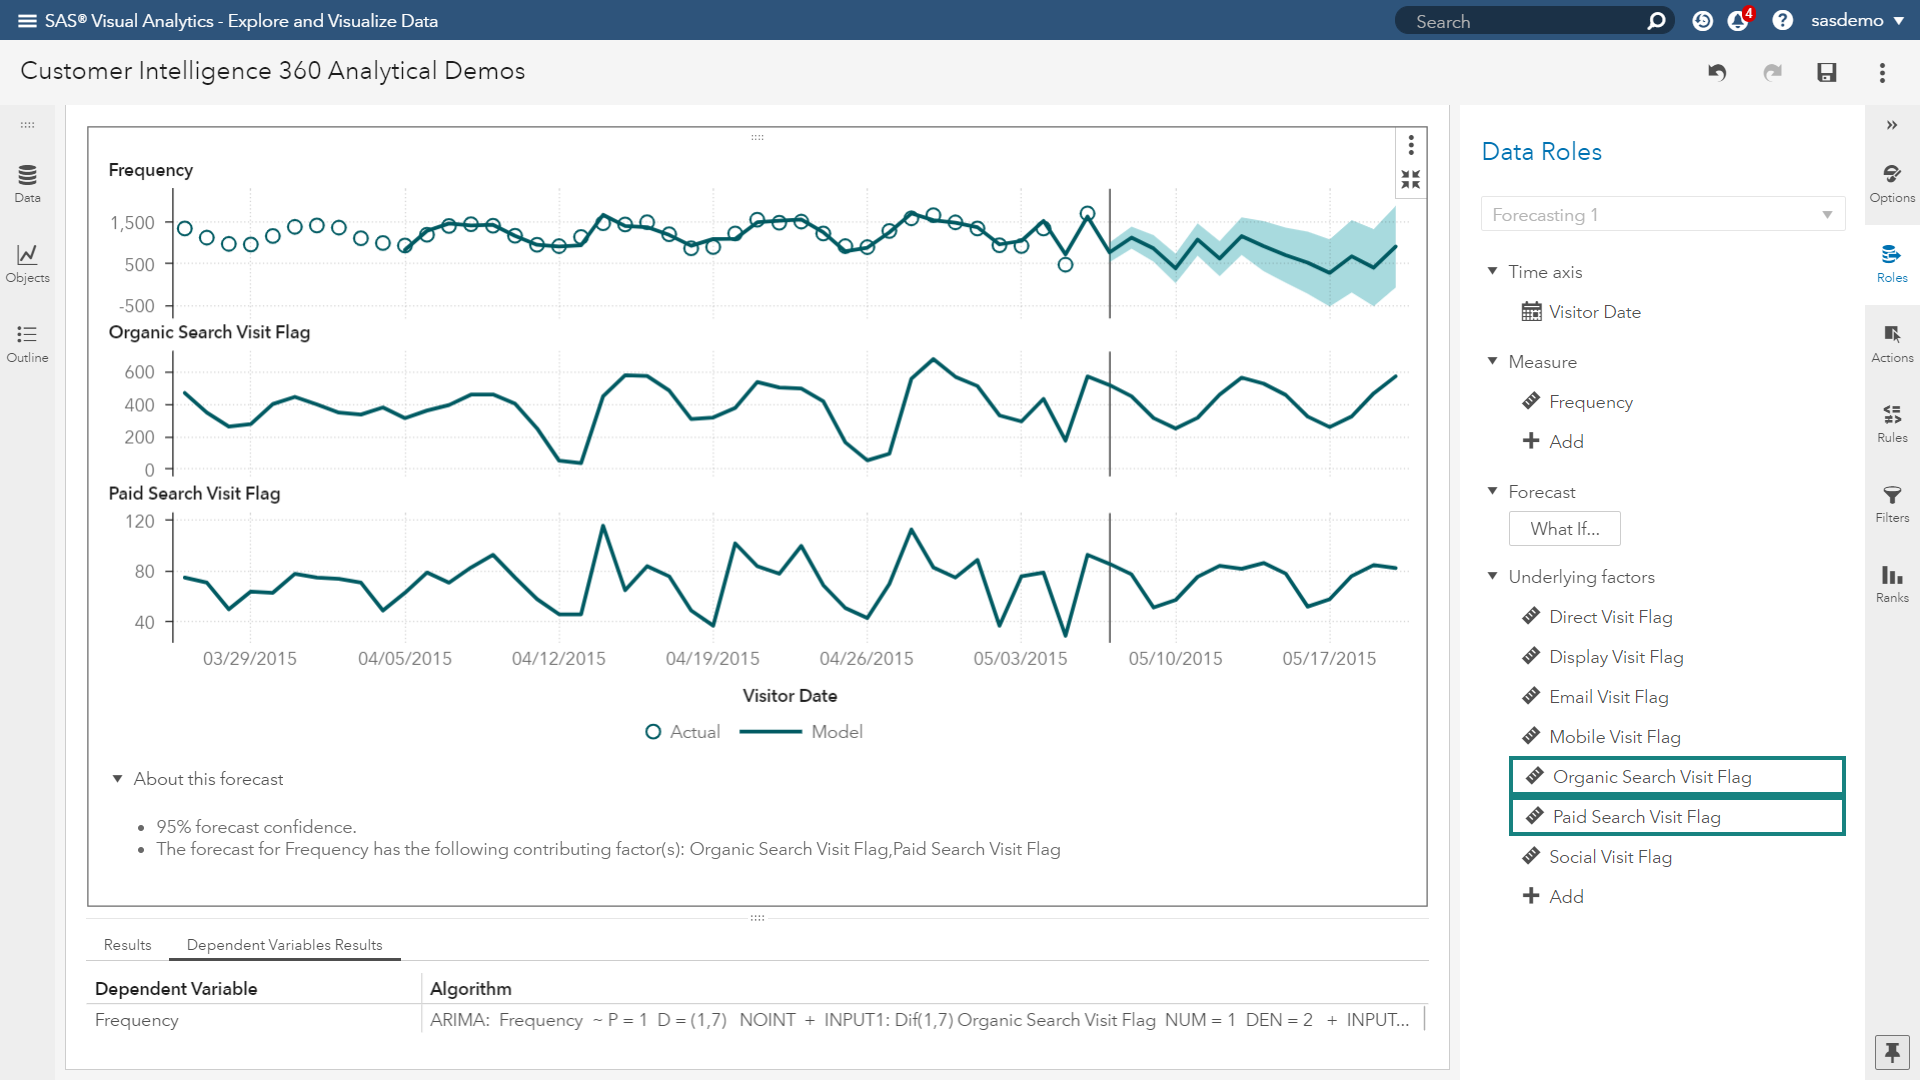
By adding these segments to the forecast model, you can see in the upper plot of Figure 3 that the confidence interval of the prediction gets tighter. This showcases greater accuracy in the model’s prediction compared with the earlier iteration. In addition, traffic sources that have an impact on the prediction are identified and visualized. The lower two plots, as well as visual border selections around the significant underlying factors, provide instant insights into the traffic sources you should be paying attention to.
There is a notable takeaway here. The curious manager in this story is interested in future traffic metrics to the website. Now that you know which traffic sources matter, the manager proceeds to ask:
How can we adjust our digital media budget and spending decisions to drive more traffic to the website?
SAS Customer Intelligence 360 enables users to simulate hypothetical scenarios by specifying the future values for one or more underlying factors that contribute to the model through what-if analysis. The model identified that two segments – organic and paid search – had a significant
effect on the forecast. Users can then simulate inflated and deflated effects of these factors, and asses how that impacts the forecast.
As a digital marketer – and more specifically, a digital advertiser or media planner – your ability to influence organic search traffic is not tied to paid media budgets. However, you have more influence over paid search, which is an ad-centric channel. What if you increase your paid search advertising budget by varying amounts? What effect would that have on overall site traffic? That is actually easy to answer.
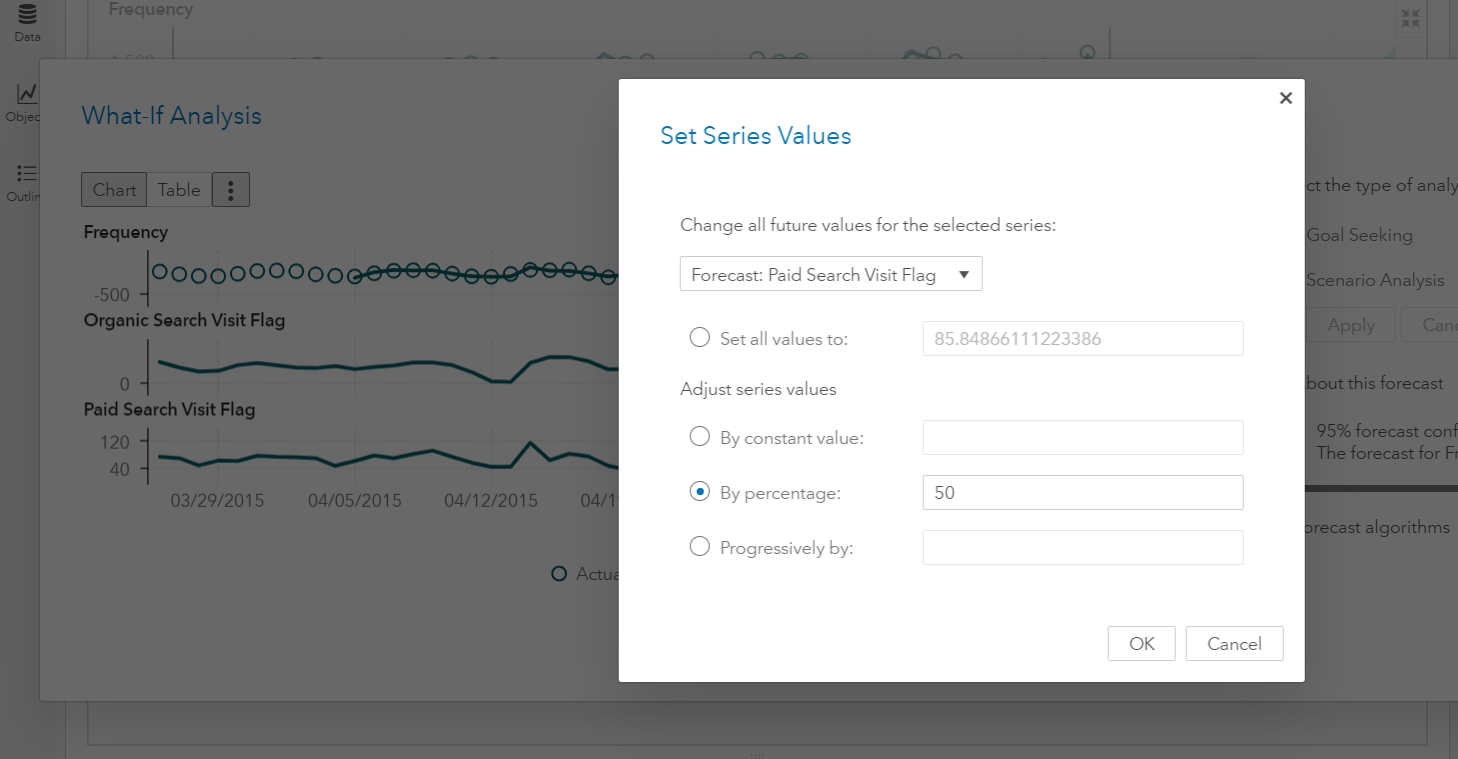
In Figure 4, a what-if scenario is defined to increase paid search traffic by 50 percent in the forecasted period. Typically, marketing teams will understand their average cost per acquisition, so an increase of 50 percent in traffic will equate to a monetary ad budget amount. After running the hypothesis, the results return highlighting the incremental impact on overall website visitation in the upper plot of Figure 5.
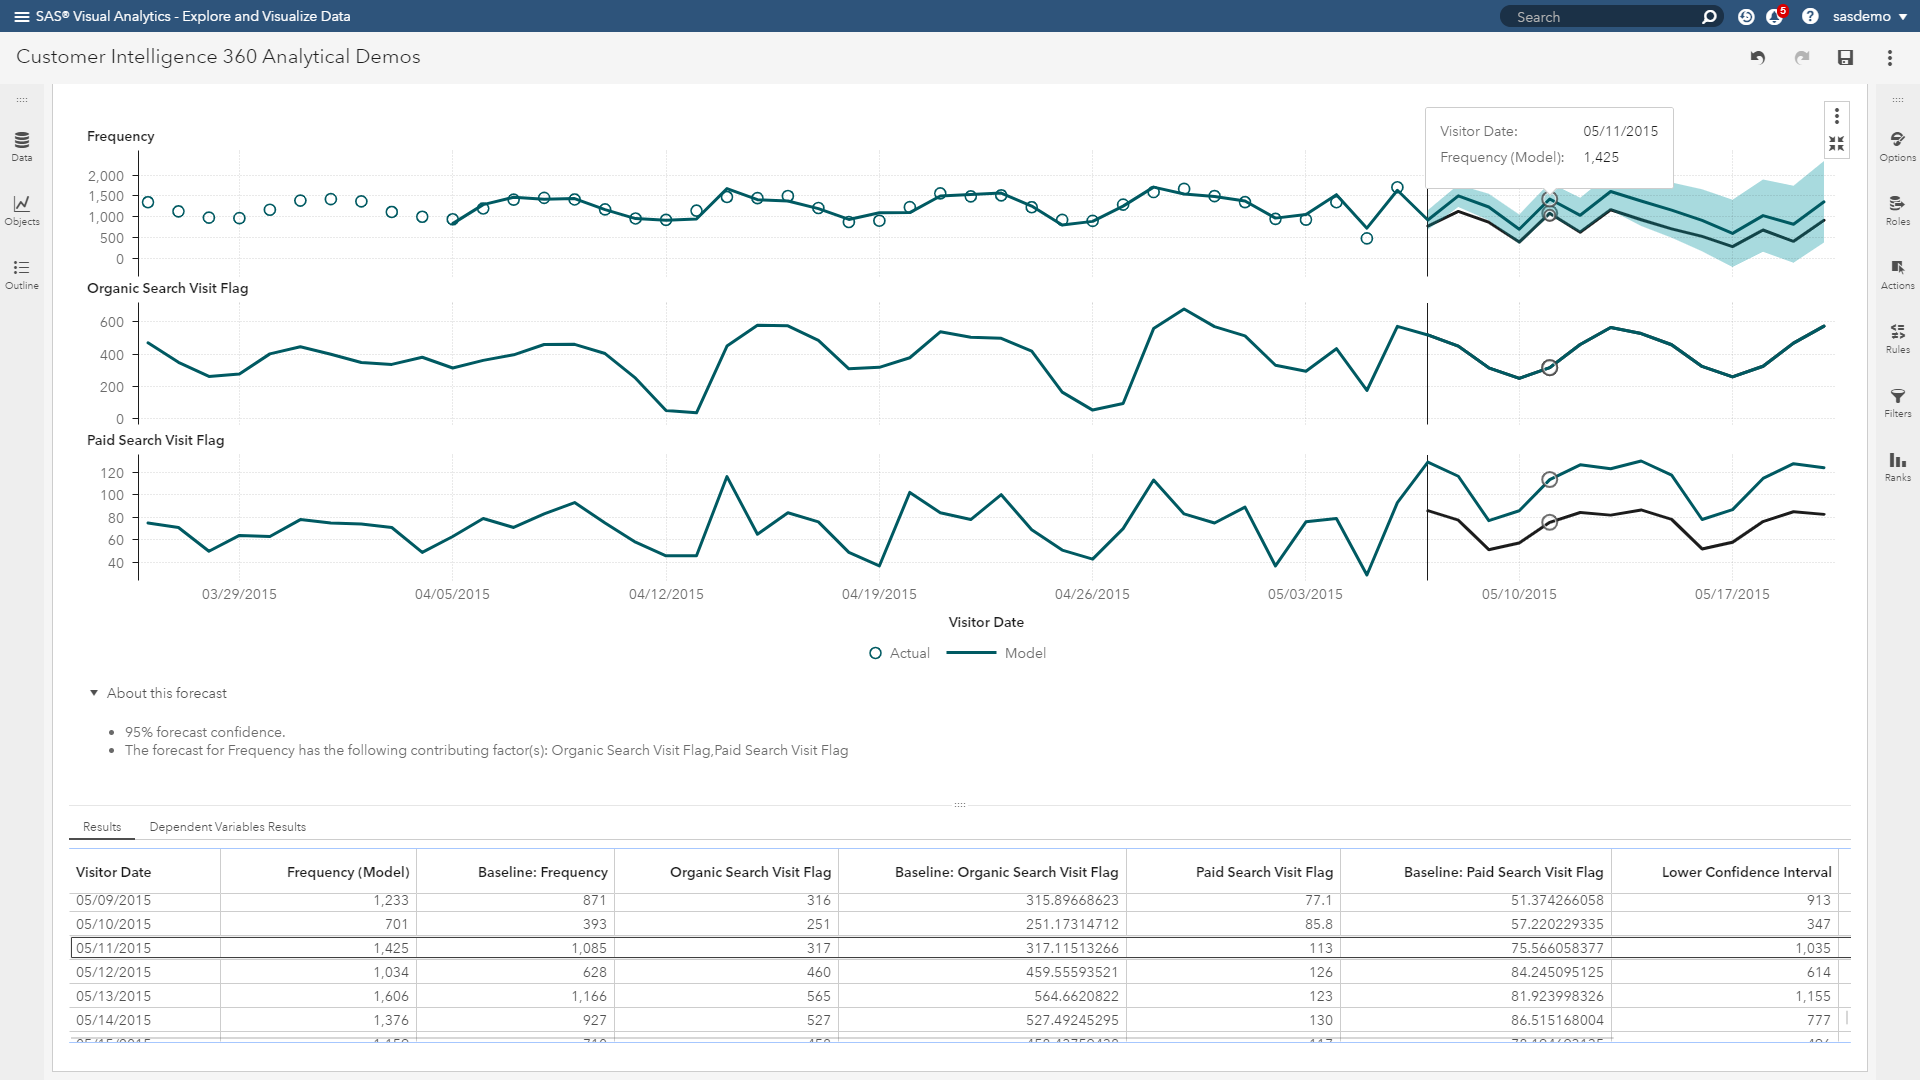
For example, there are two numbers representing website traffic for May 11th. The baseline frequency is the original forecast: 1,085. If you increase paid search by 50 percent, you can expect 1,425 site visitors. That means that a 50 percent increase in ad spending on paid search is predicted to produce an approximate 31 percent increase in overall traffic over the next two weeks.
Based on how your organization manages budgets and decisions, you could explore different what-if scenarios. For example, you could determine if the impact of increasing paid search advertising by 25 percent or 45 percent would be worth the investment.
However, this just isn't good enough for your inquisitive manager. Frustrated by the amount of time it might take analysts to run through a seemingly endless number of what-if scenarios, a light bulb goes off in the quest for the ultimate answer:
How can we optimize our digital media budget and spending decisions to double the volume of forecasted traffic to the website?
Ah yes. The queen bee of questions has arisen, and SAS Customer Intelligence 360 enables users to flip the switch on the analysis.

Goal-seeking enables users to specify a target goal for the forecast measure, and then determine the values of the underlying factors that are required to achieve the objective. In Figure 6, take note in the upper right corner a user can adjust their selection from scenario analysis to goal-seeking.
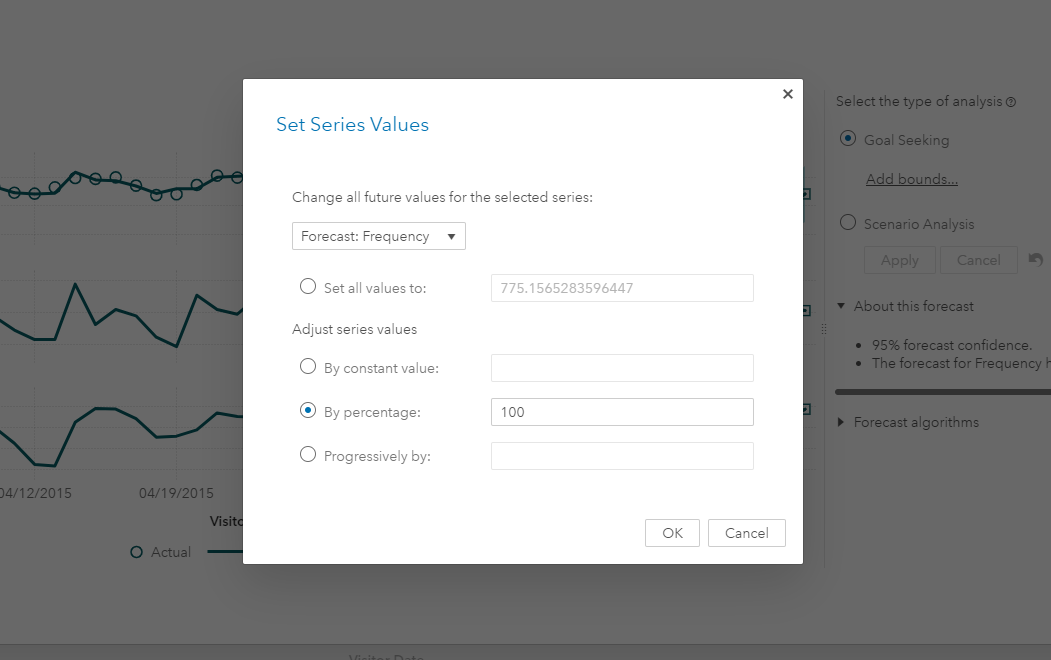
Subsequently, you insert the target value to adjust the time-series. Figure 7 highlights an objective of increasing web traffic in the forecast by 100 percent. What values of the underlying factors related to paid search media will allow for a feasible solution in meeting these criteria?
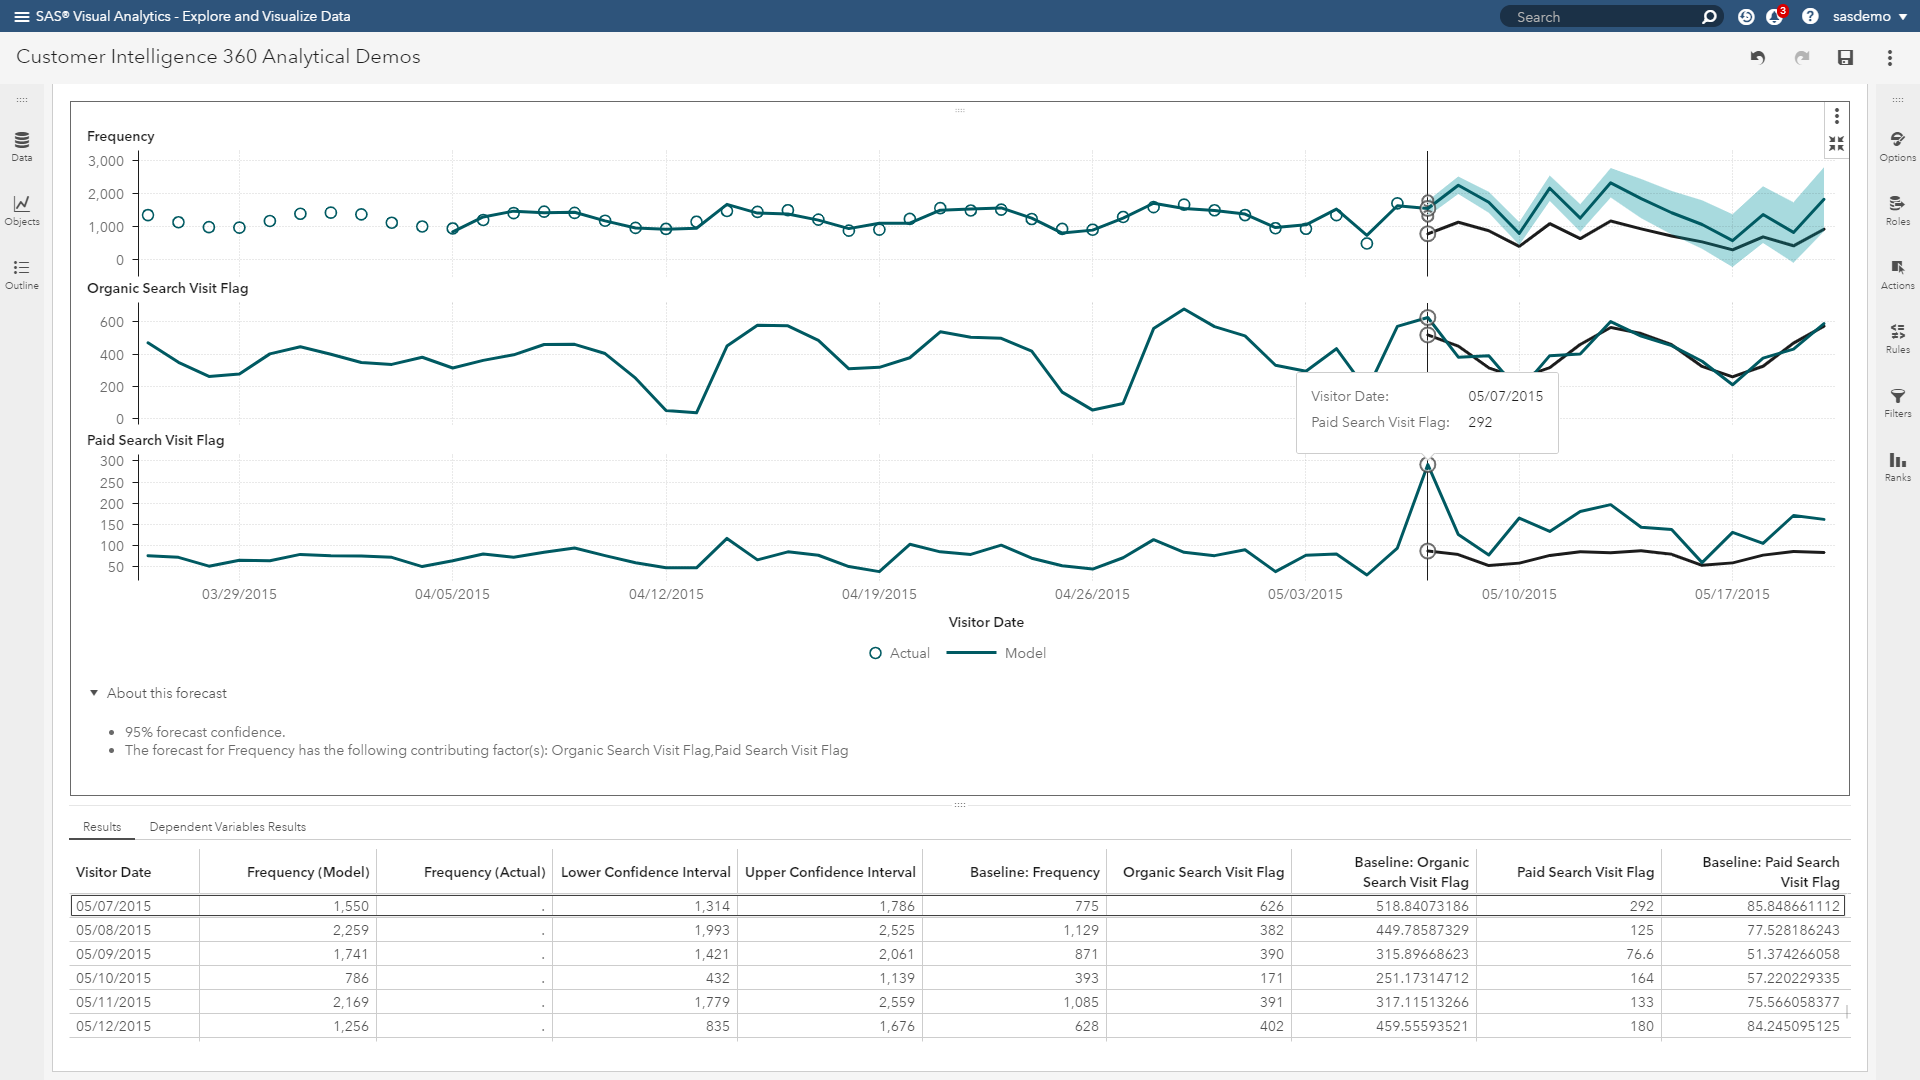
The results return, and due to the beauty of visual insight, you can see in the lower time-series graph of Figure 8 that the incremental values needed by date to meet the defined goal. But there is an odd spike for May 7th and the prescribed volume associated with paid search traffic. Let’s assume this scenario is considered impractical by your manager.
You can return to the goal-seeking analysis and assign constraints. This allows the optimization routine to identify a practical solution that the brand can act on.
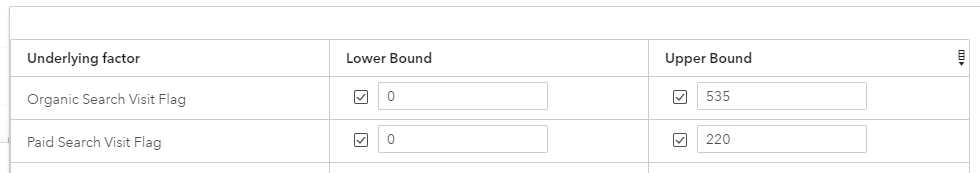
The logic behind the values the user assigns in Figure 9 is based on:
- Organic search traffic cannot spike higher than the original forecast because this is not an ad-centric media channel. The brand cannot throw money at this touchpoint.
- Management is only willing to spend a certain amount of budget on a single day within the paid search channel.
With this said, here is an optimized recipe to meet your goal of doubling website traffic in the forecasted period.
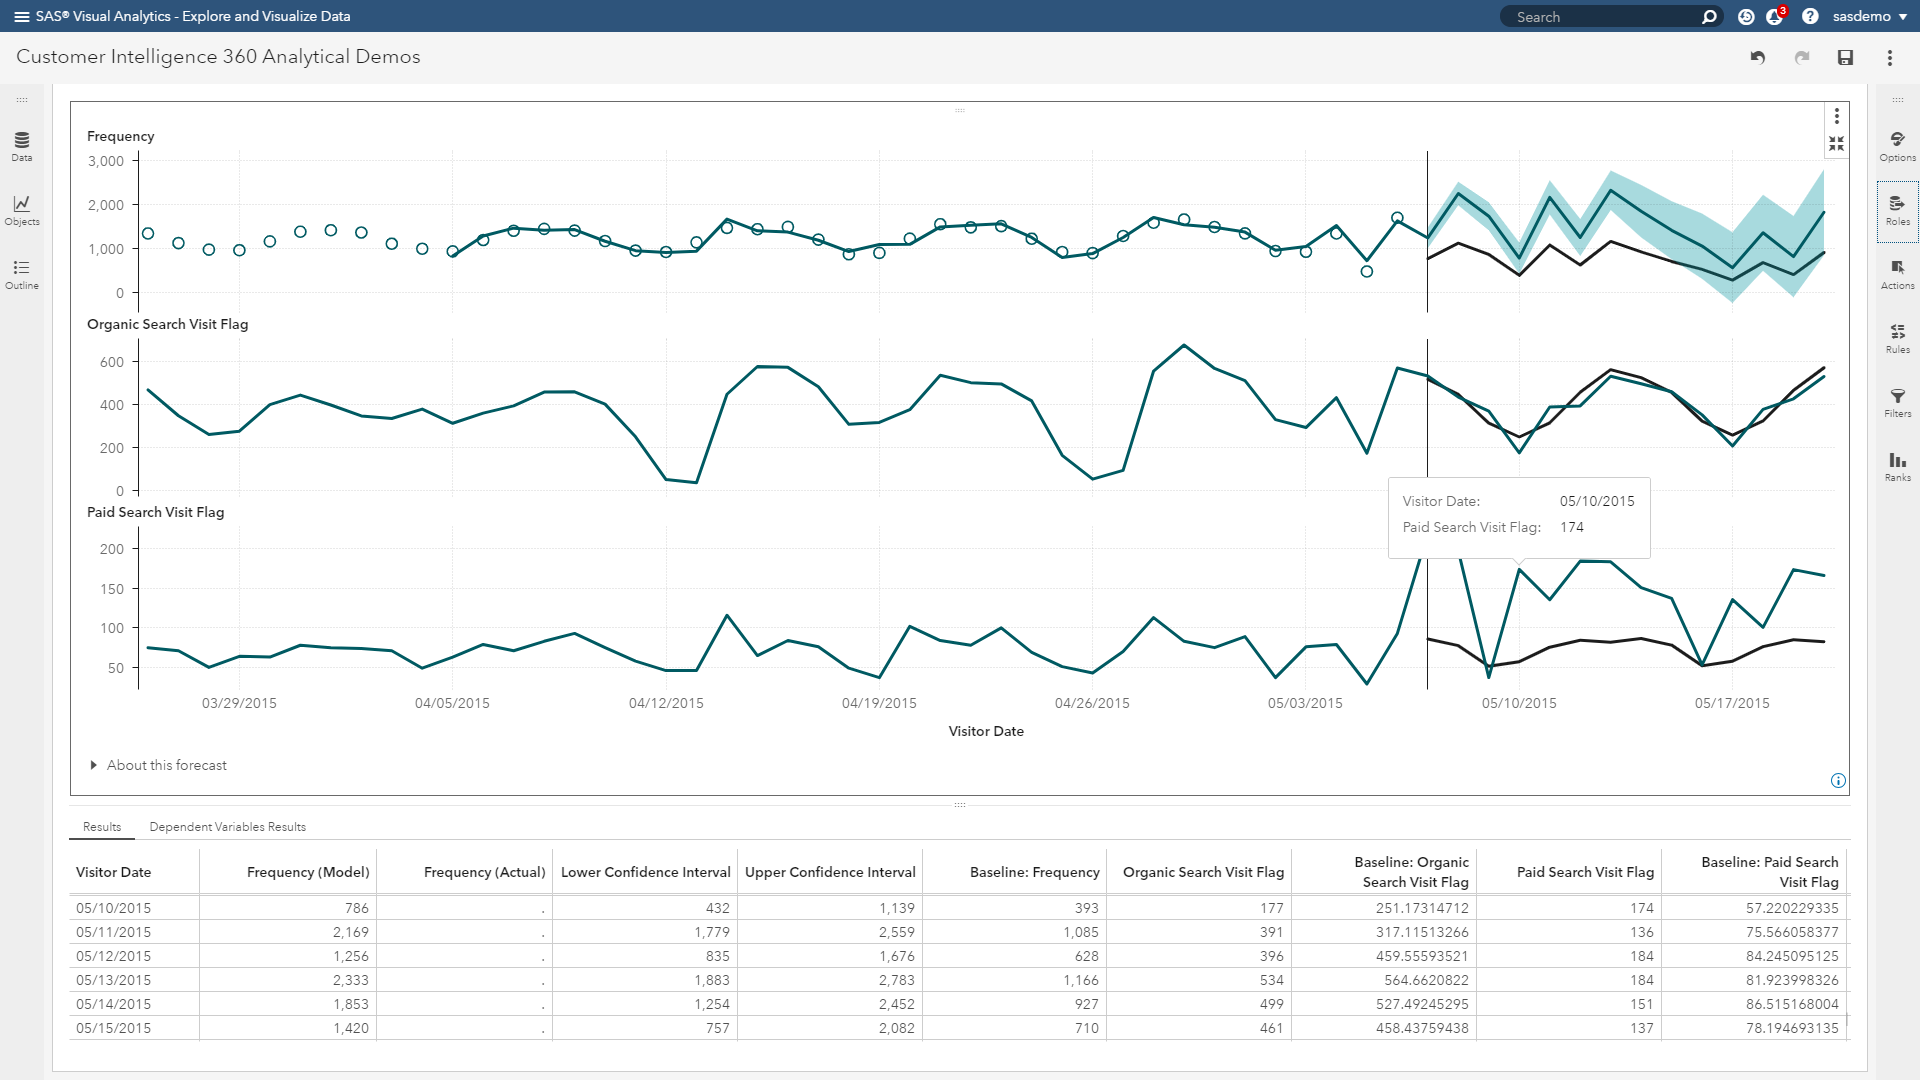
Remaining focused on the results of the lower time-series plot, as well as the underlying summary table at the bottom of Figure 10, let’s share an interpretation for the date May 10th:
- Based on your forecast’s baseline estimate, you are expecting 57 visits attributed to paid search.
- After running the goal-seeking analysis, you need to hit 174 attributed visits.
- Using easily attainable key performance metrics for search campaigns like cost-per-acquisition and impressions-per-acquisition can help formulate the actionable steps to be taken by the search marketing team.
The results overall highlighted in Figure 10 provide actionable recipes for the entire forecast.
Figure 11 below summarizes how SAS Customer Intelligence 360 enables users with a single platform to attain rich customer insights for personalized marketing and decision management. From forecasting to propensity modeling to next-best-actions, it unifies the entire machine learning process, from data access/transformation and preparation to actionable scoring. Please check out other use cases here.