Path analysis is an exploration of a chain of consecutive events that a given user or cohort performs during a set period while using a website, online game or mobile app (although other use cases can apply outside of digital analytics). As a subset of behavioral analytics, path analysis is a way to understand user behavior in order to gain actionable insights into the data.
While it is possible to track a user’s path through a website, and even show that path as a visual representation, the real question is how to gain these actionable insights? If path analysis simply outputs a "pretty" graph, while it may look nice, it may not provide anything concrete to act upon.
There is a psychological mindset that, just like in the offline world of purchasing and marketing, there is only one way to get to a goal. However, the digital world is different!
Secondly, brands and marketers (although they may never admit it) have a desire for control and to put consumers on a specific path to meet a business objective. The question we ask then:
Is consumer behavior that predictable?
As I have met with clients over the years, I have frequently heard (or witnessed debates) that pathing analysis is a waste of time. The reasoning behind this is that the increasing fragmentation of visitor pathing presents an incredible analysis challenge. Let’s review a culprit for this problem that we are all familiar with - search engines.
Whether it is Google, Bing, Yahoo, or Baidu, we use search platforms relentlessly to find relevant content. Let’s say I’m familiarizing myself with what SAS has to offer the world.
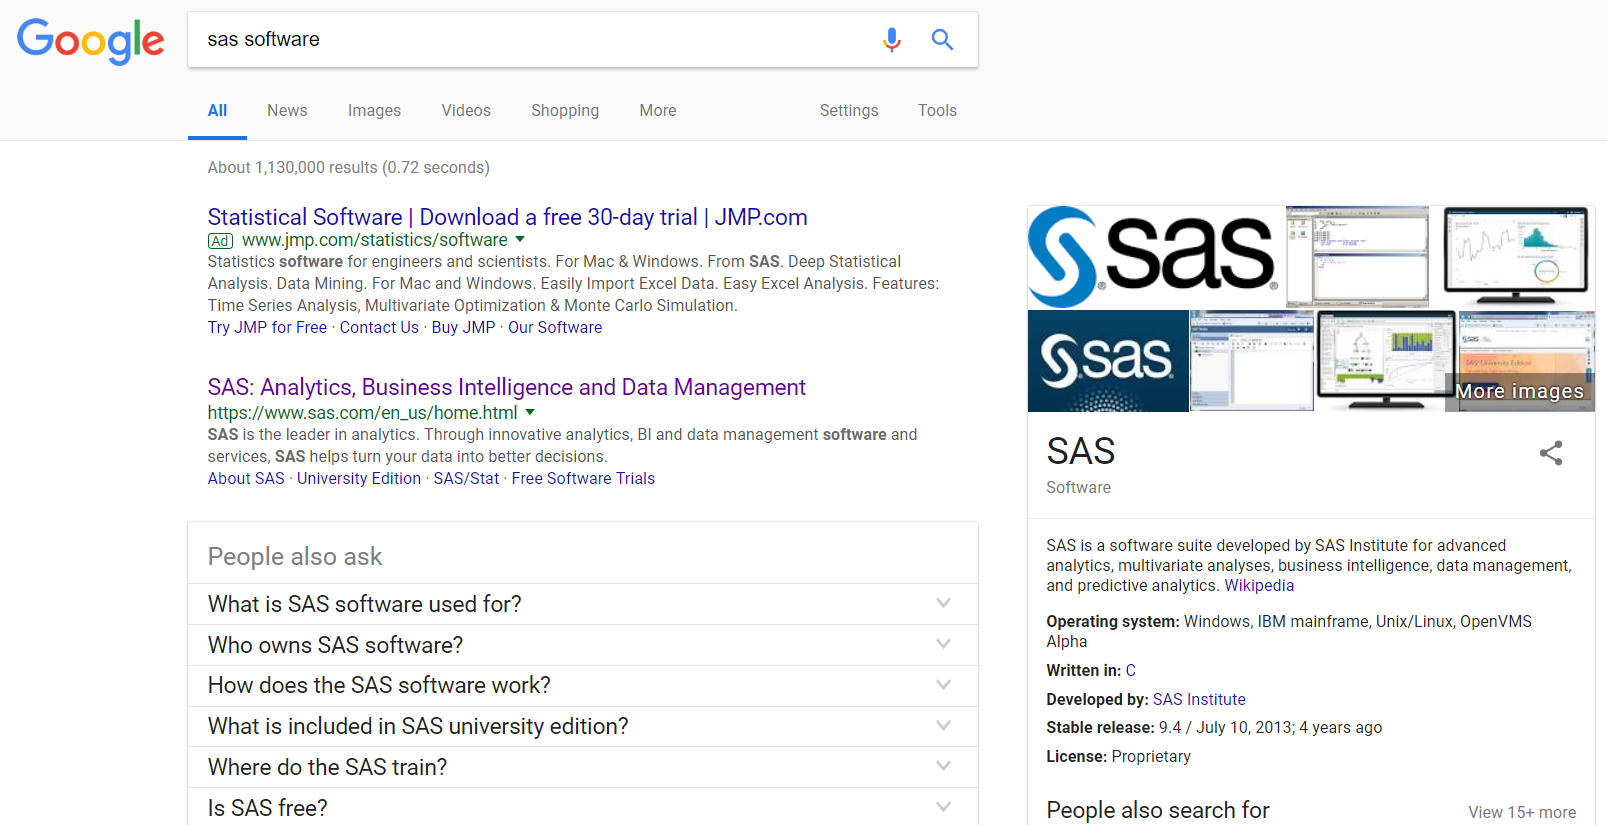
Do you see all the available drop downs for the section entitled “People also ask”? Each of those leads a user to a different starting location (or landing page) on the SAS website. If we were to scroll down further, we would find more links with unique URLs. In a world dominated by search engines, the starting point of a path isn’t determined by your organization, but the search engines themselves.
Is there an optimal path? Most likely not. If you’ll consider the concept of linearity for a moment, the idea of path analysis is the hope that people will follow a series of steps:
1 - 2 - 3 - 4 - 5 - 6 - 7 - 8
However, in reality, people do things more like this:
1 - 2 - 3 - 2 - 3 - 1 - 4 - 5 - 6 - 1 - 7- 1 - 8
The optimistic view that consumer behavior is linear has led many to believe that traditional digital analytic tools struggle to accommodate the non-linearity of human behavior online.
Path analysis - Is it still relevant?
There are exceptions. Structured experiences represent subsets of a digital experience that are a good fit for path analysis – examples like online application forms and product purchase check out processes commonly achieve successful results.
But think about the business objective of every online form or check-out funnel that you have experienced. The brand’s mission is for the visitor to complete the task. What drives an organization mad? It’s when you start, but don’t complete the process. The visitor transforms from a cold to hot lead in meeting your macro-conversion goal, but suddenly disengages. What happened? We were getting along so well. And then poof! The revenue was at your fingertips, and now it's disappeared like a ghost in the night.
Senior management obsesses about the missed opportunity of large percentage drop-offs related to conversion goals, and analysts fret because they struggle to answer why. In actuality, a better name for path analysis might be “abandonment analysis”.
Path analysis and SAS Customer Intelligence 360
Leveraging data collection mechanisms, SAS 360 Discover captures first-party behavioral information across the entire digital customer experience with a brand’s websites and mobile apps. As visitor journey data flows in, SAS transforms that valuable information into structured views, allowing an analyst to perform path analysis. If that short appetizer on SAS 360 Discover captured your interest for more details, check out this primer.
When someone interacts with your brand digitally, they leave a sequential data trail. Attributes like traffic sources, pages viewed, goals achieved and other events of interest are available. Analysts can adjust their scope to focus on sessions, anonymous visitors or identifiable traffic. Segmentation of journeys is enabled within a single click based on any available dimension, and when analyzing identifiable traffic, both online and offline variables can be filtered on. Most importantly, we aren’t conducting an exploratory exercise to add entertainment to your Friday afternoon team meeting. To enable one’s ability to segue from research to driving results, SAS Visual Analytics is the provided analysis tool for SAS 360 Discover. Exporting discovered segments into SAS 360 Engage for targeting and personalization closes the loop.
Let’s go through an example. We will use a Sankey diagram that summarizes visitor journeys to sas.com during a specified period to identify an abandoned audience segment ripe for re-engagement.
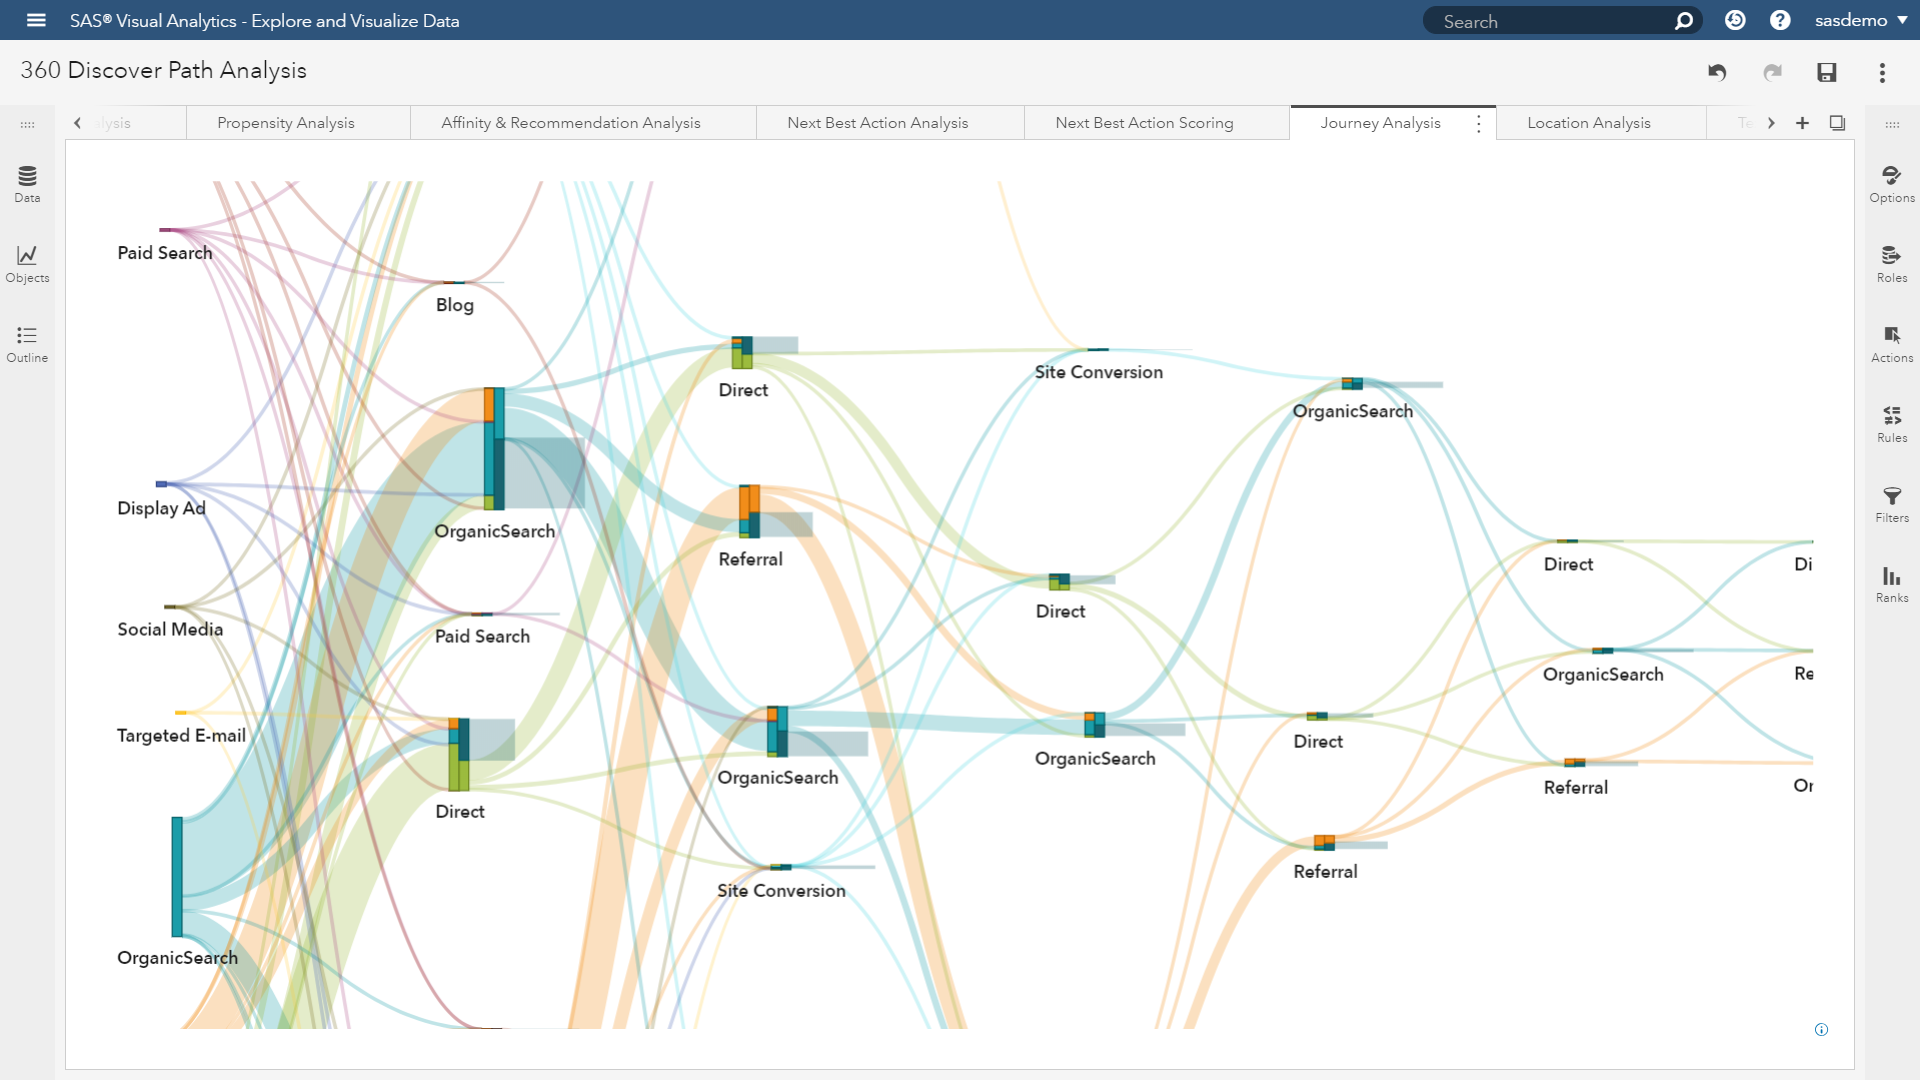
At first glance, it looks like a plate of colorful spaghetti. This visualization was created with three attributes:
- Visitor activity (what did they do?).
- Visitor activity timestamp (when did they do it?).
- Visitor identifier (how many people follow a unique path?).
There are close to 2,000 unique journey types in the analysis. To help circumvent the challenge of focusing on the signal, and suppressing the noise, SAS Visual Analytics provides path analytic properties to assist users derive a clearer picture. For example, I can set filters to only show journeys that:
- Contain two or more events (this filters out “bouncers”).
- Hold 50 or more visitors within a unique journey (this filters out rare journeys with low sample sizes).
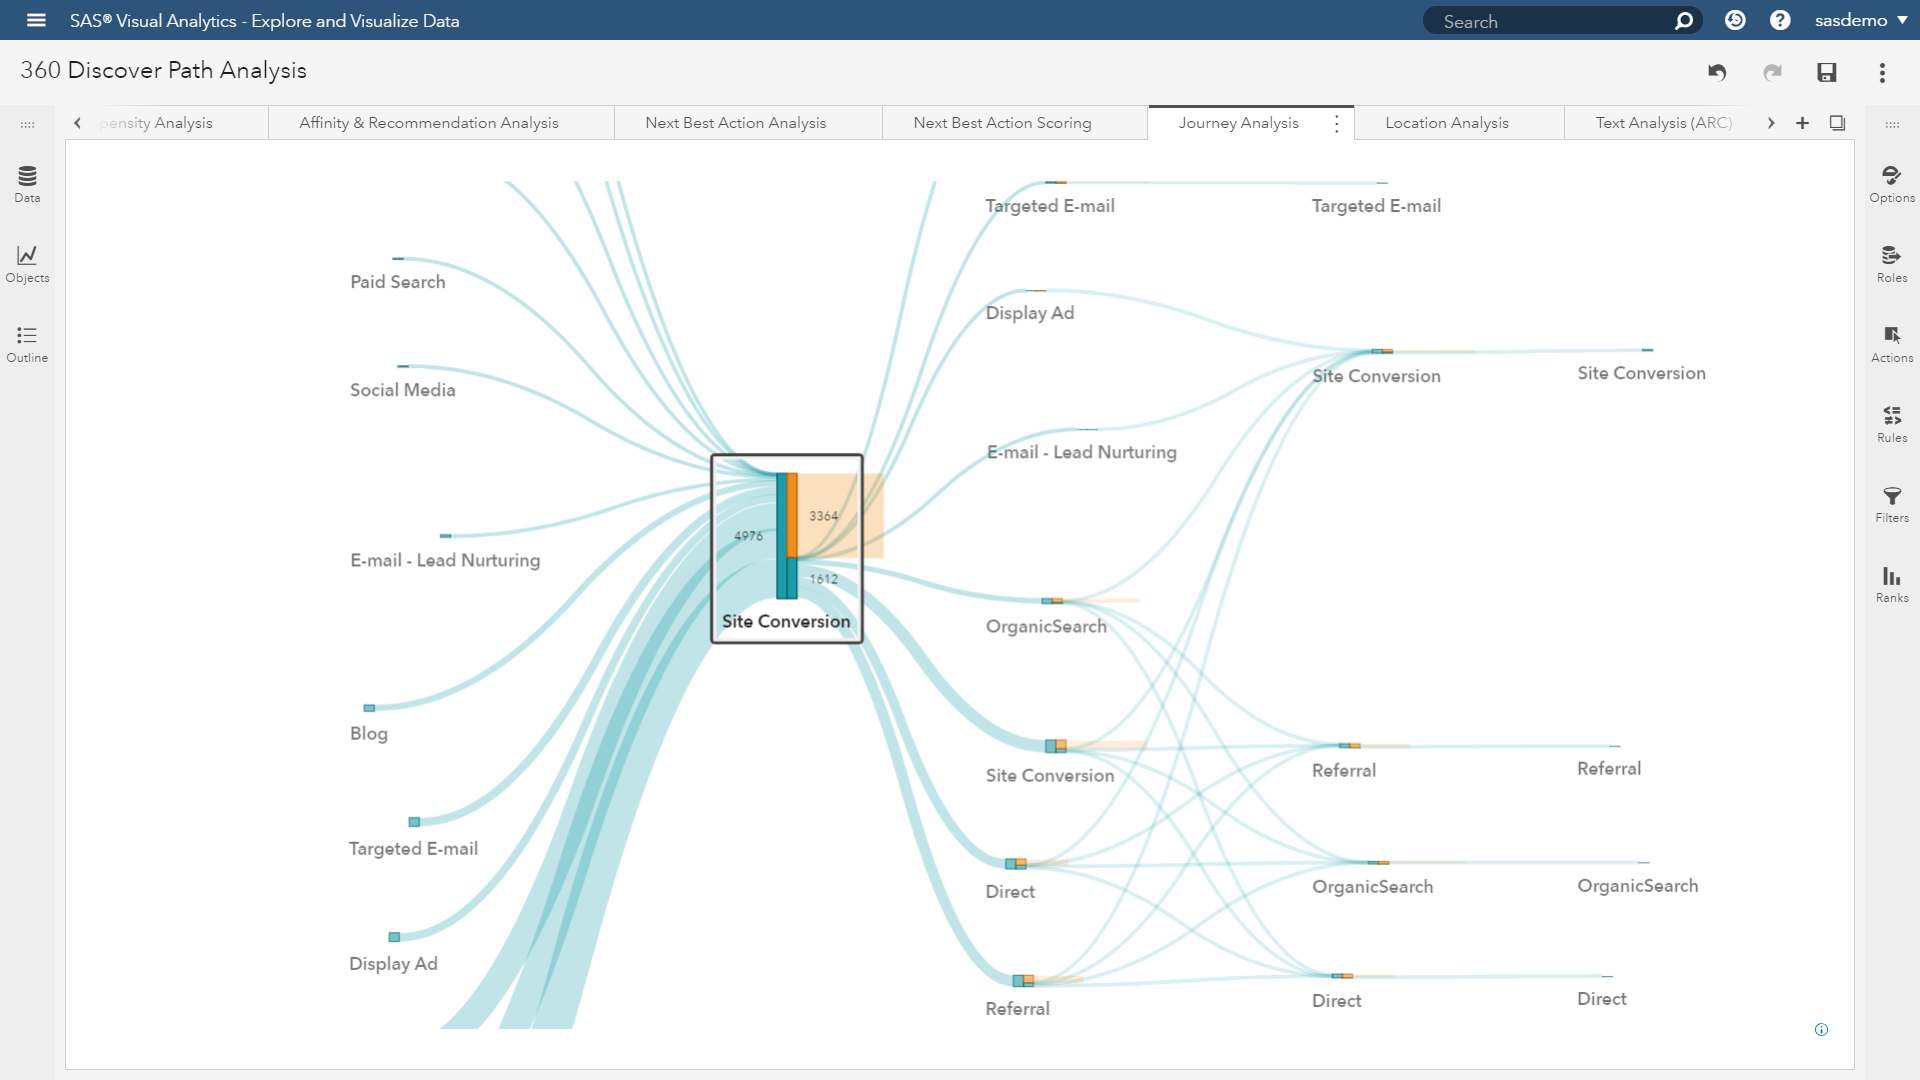
In addition, users can color code each journey by unique path, event or drop off. Because our objective is to identify attractive groups for re-engagement, I will assign the drop-off setting to the visualization.
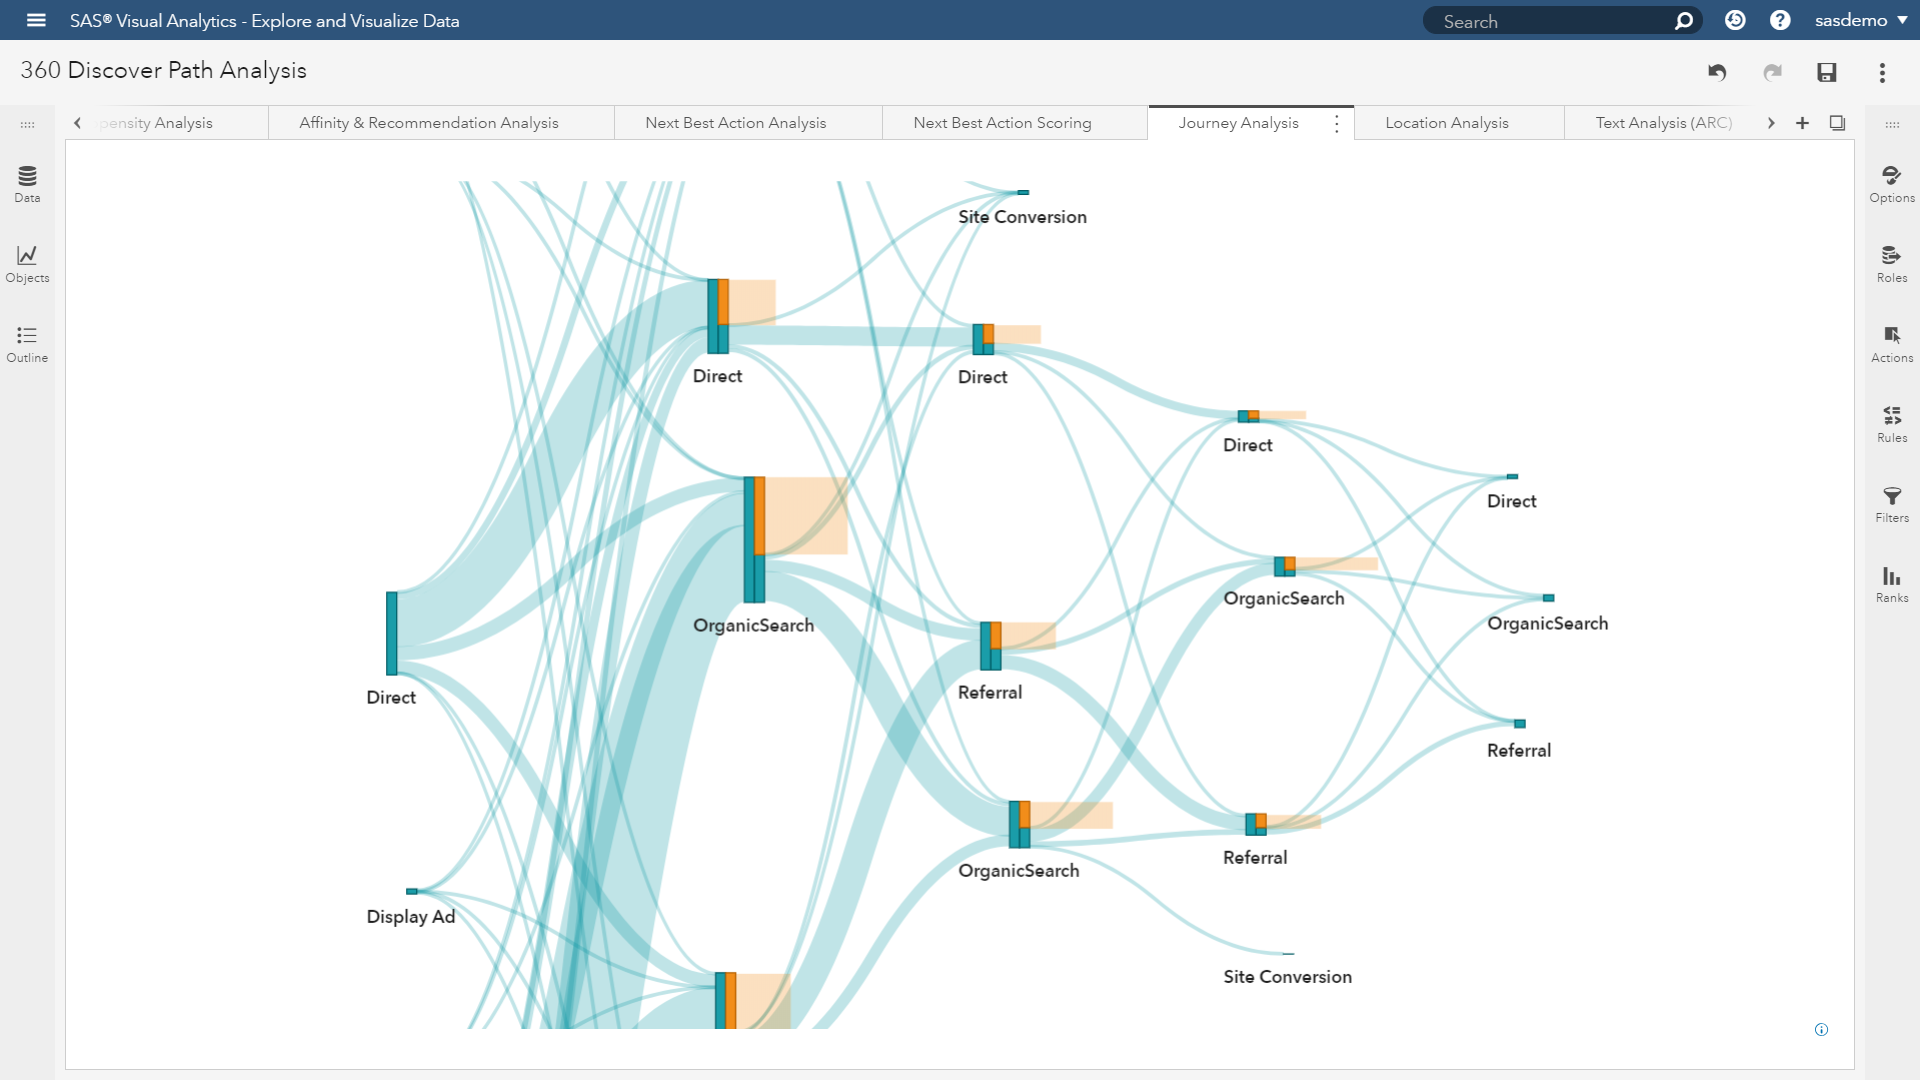
The paths are now following a two-color scheme. For each step along the journeys, orange blocks represent audiences that did not interact with SAS again. These are the abandoner segments. From a re-engagement perspective, one approach is if a visitor converted once, SAS could run a marketing campaign targeted at anyone who hasn’t interacted with SAS since their first conversion. Clearly, they liked something SAS has to offer, and the digital marketing team wants to deepen relationships with new customers.
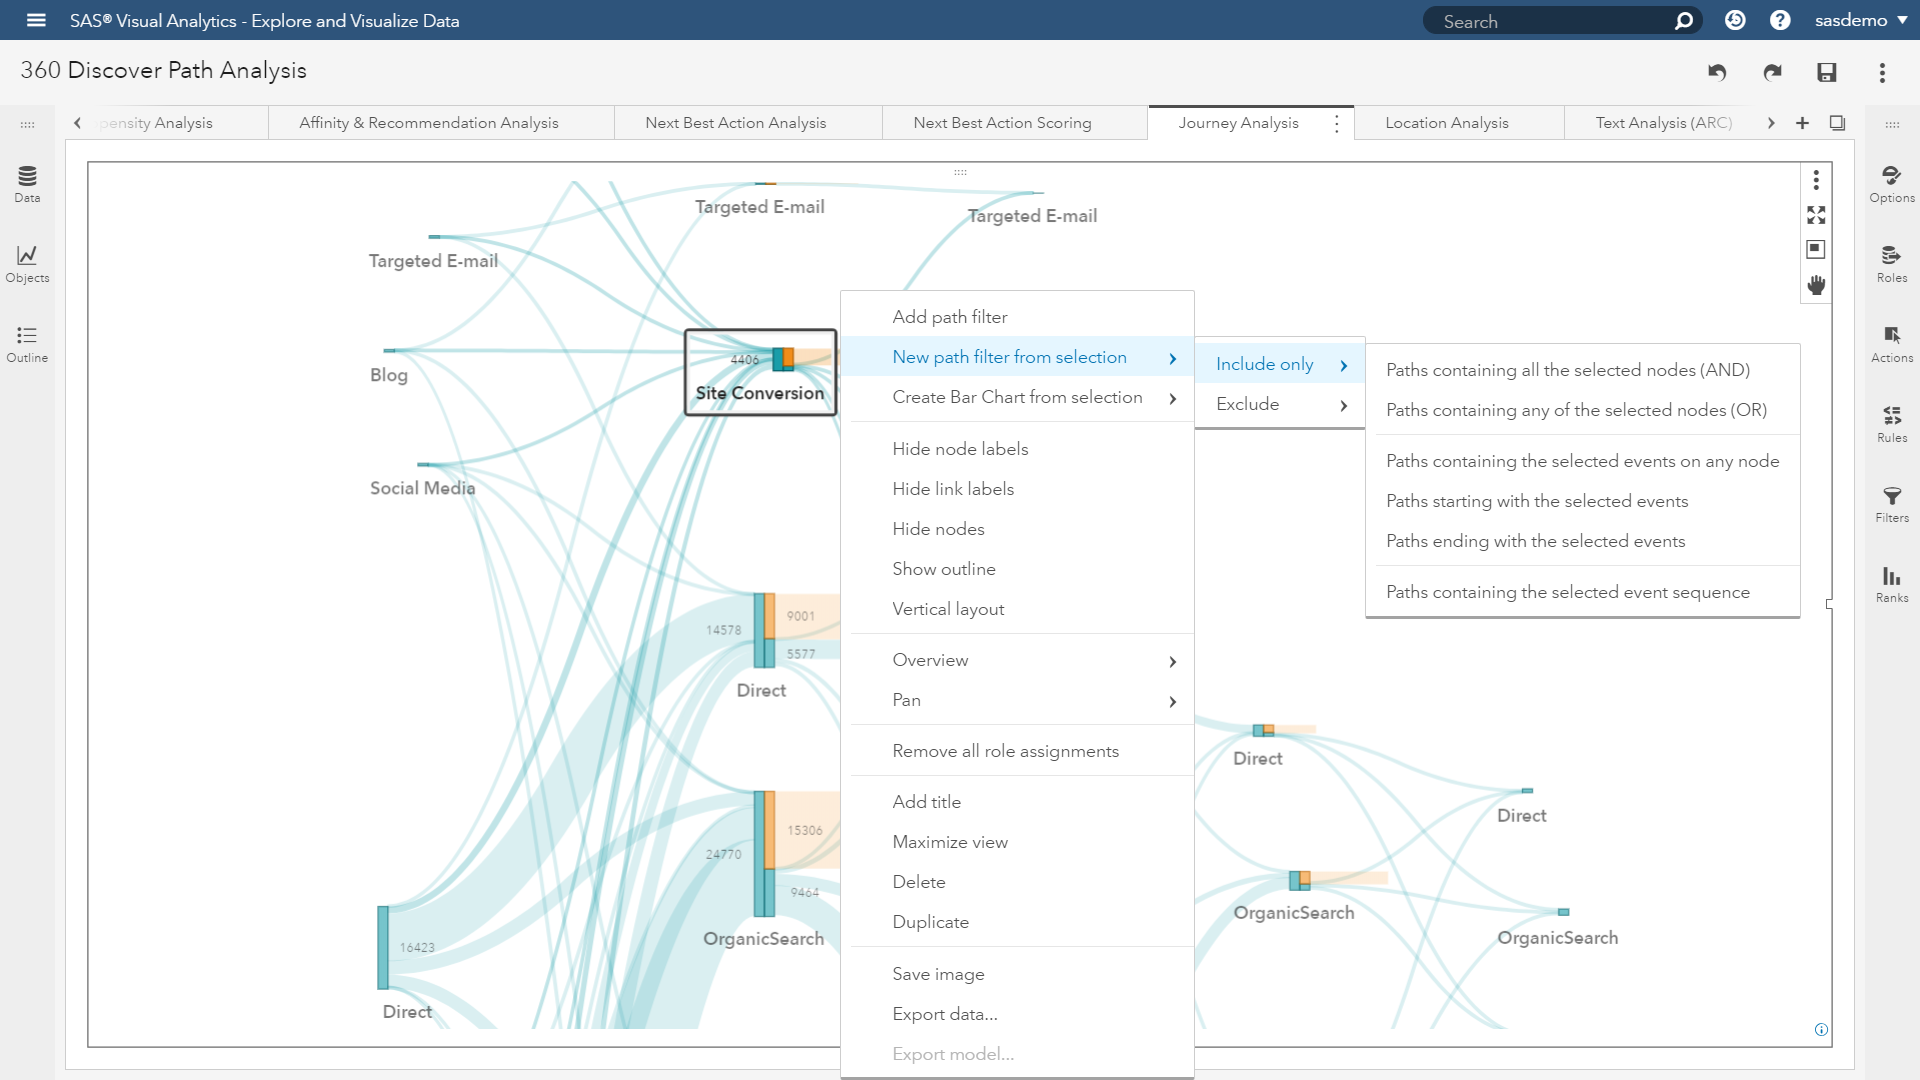
Interactively selecting the journey milestone of site conversion gives users the ability to reduce the visualization down to this specific segment, and their unique paths solely. The spaghetti is becoming more appetizing!
Sixty-eight percent of this audience has converted once at sas.com, but never returned. This is a group that can be analyzed algorithmically for targeting next-best offers. We can even decorate this segment with additional first- or third-party data to deepen our understanding of their unique profiles. But first, we must eliminate the other thirty-two percent of journeys that continued interacting with SAS.
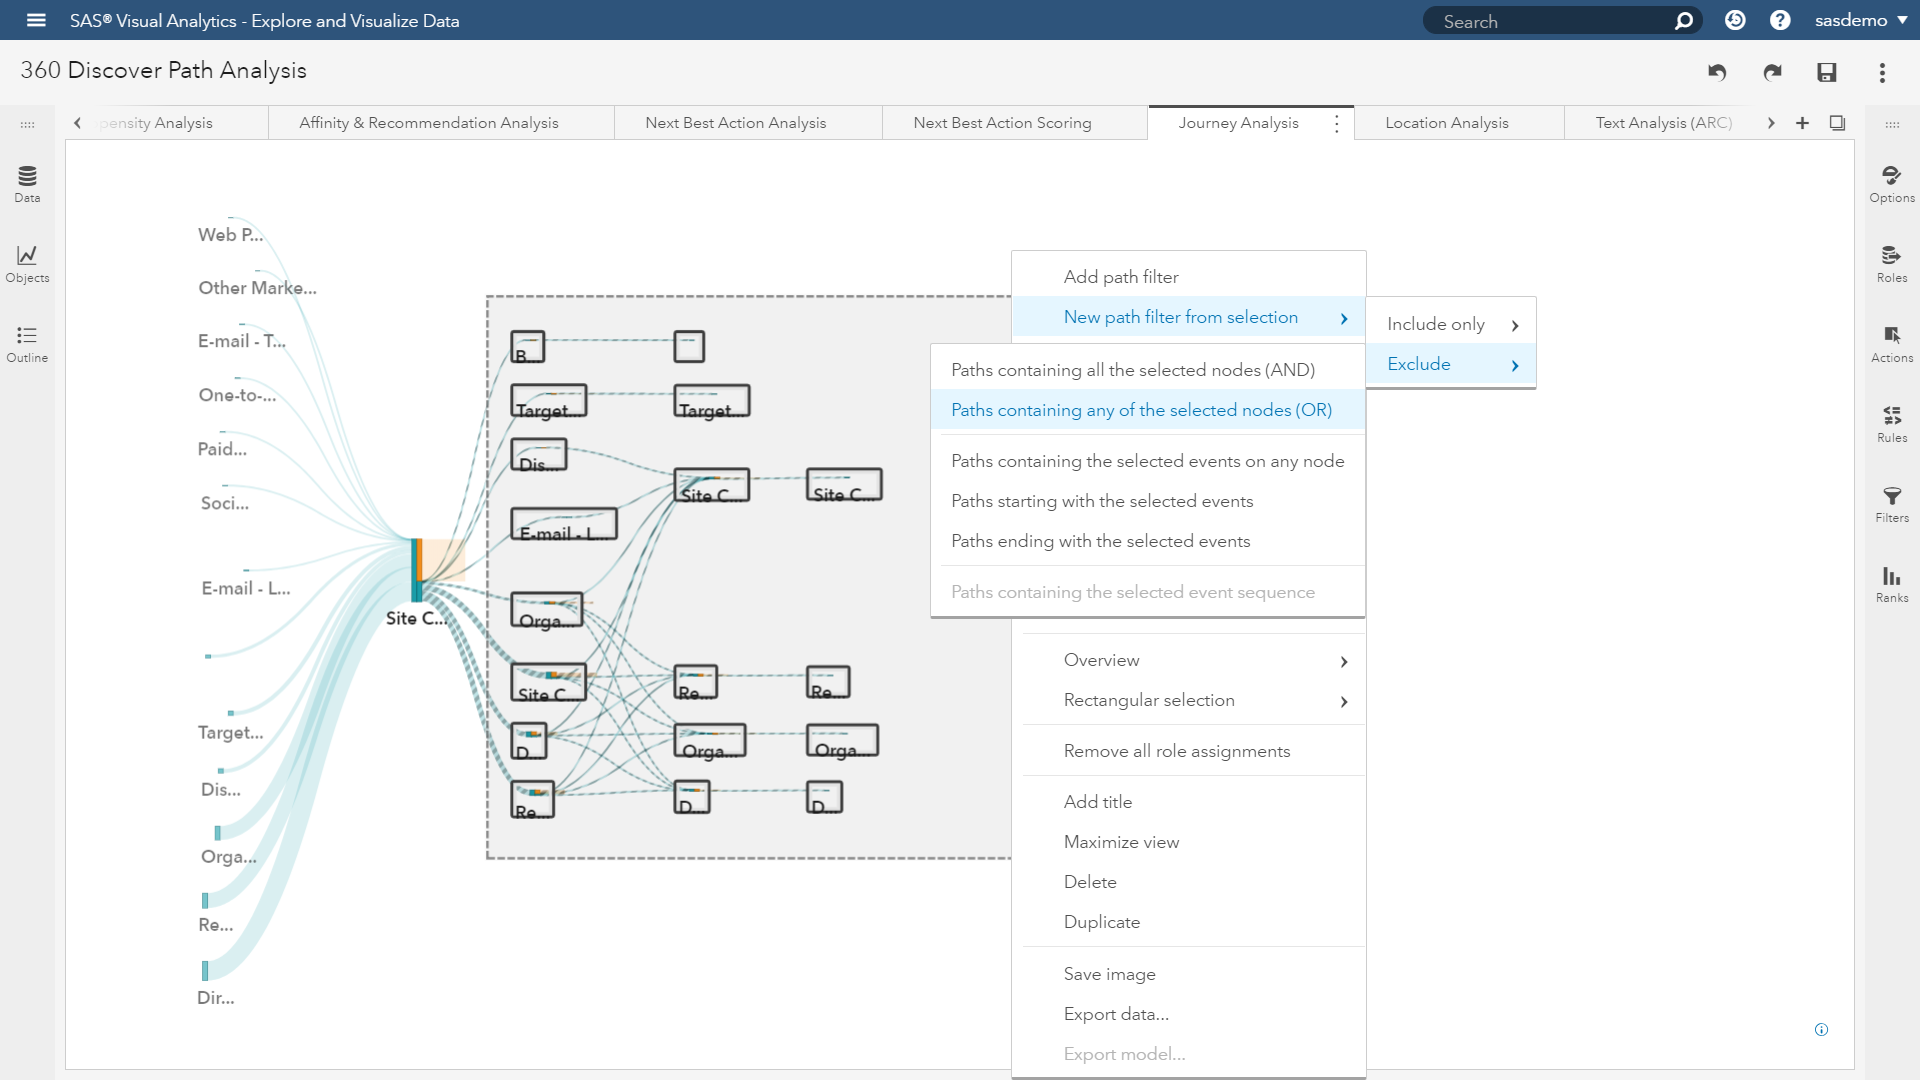
After exclusion filtering is applied, we have reached the step of transitioning from path analysis to taking action. Although we could jump into a propensity modeling exercise (we are SAS after all), rest assured users can leverage a variety of methods.

However, I would like this example to focus on providing a marketing team the ability to target this disengaged audience, so I will change the visualization from a Sankey diagram to a list table.
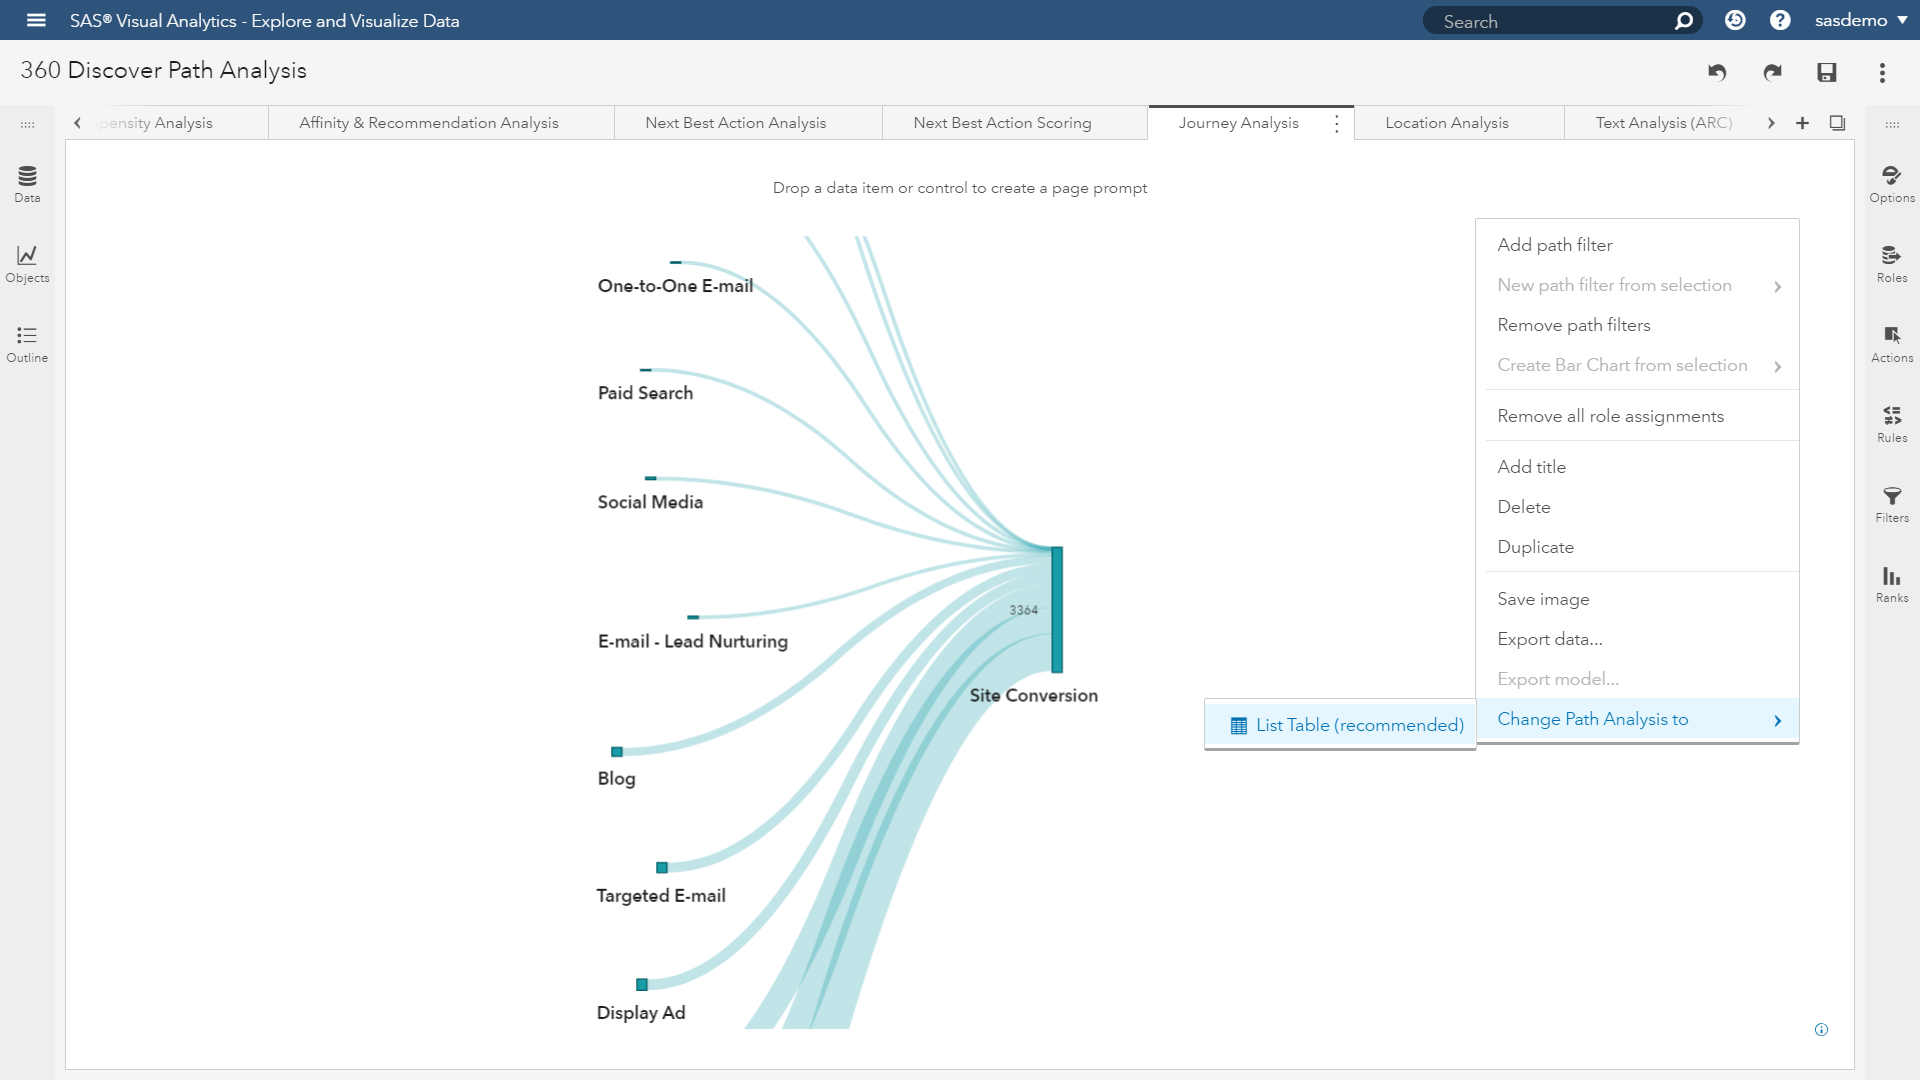
The importance of this step is that all of my interactions of the path analysis created an intricate filter. With that filter definition, I can use it to isolate my segment while adding more attributes into an exportable table. Identifiers at the customer, visitor or session level are easily added along with digital activity, transactions, demographics or psychographics.

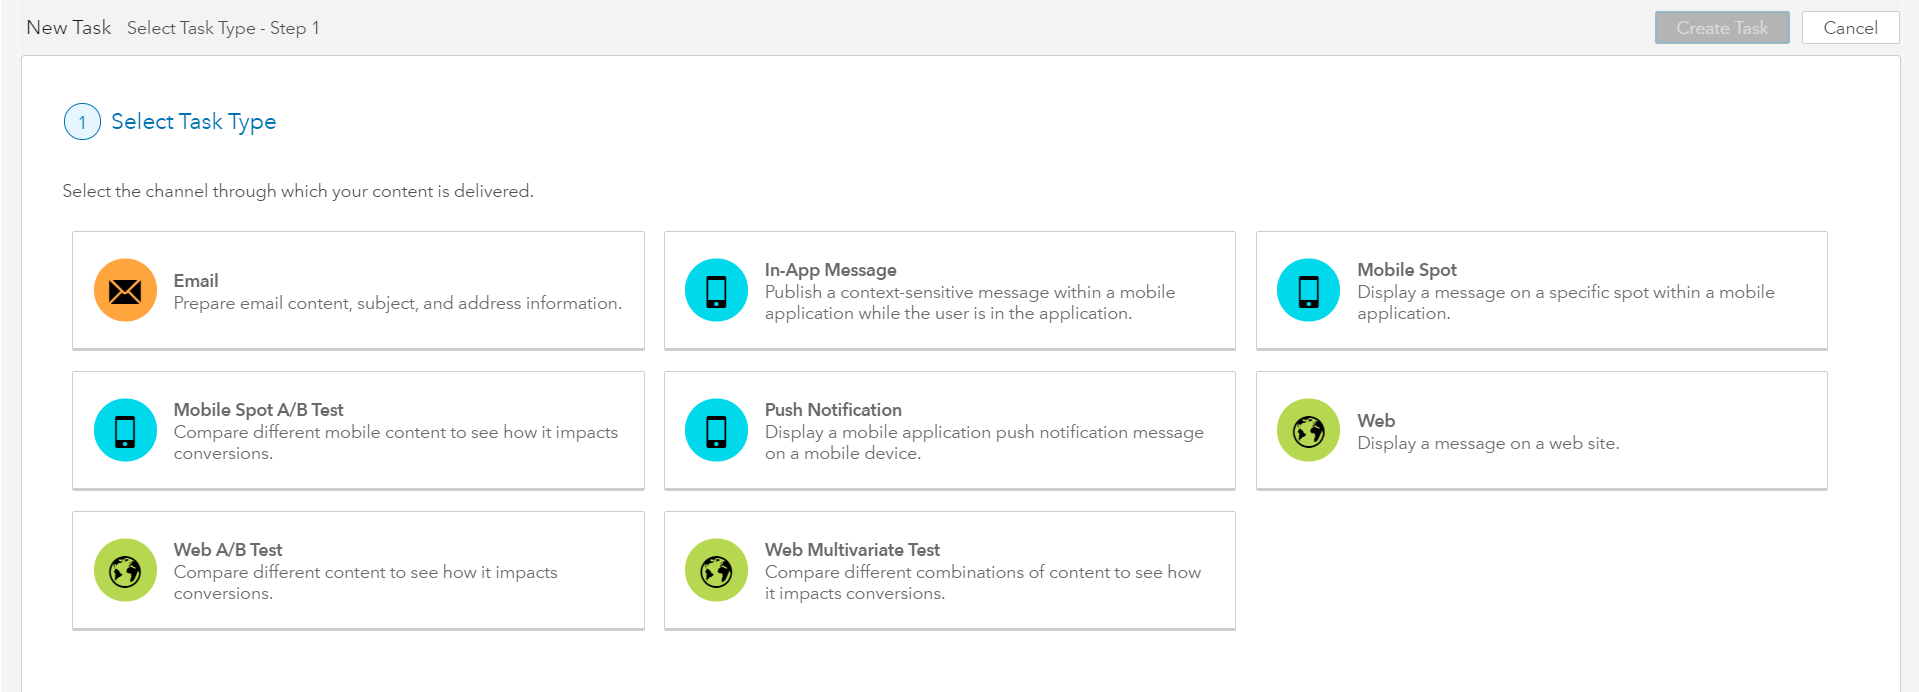
By having the ability to export the audience, users can target this segment for marketing interactions within SAS 360 Engage across a variety of digital channels, whether it is web, mobile or email. Watch this video to learn how to import data into SAS Customer Intelligence 360. Once imported, the marketing team is ready to re-engage!

2 Comments
Wonderful site you have here but I was curious about if you knew of any user
discussion forums that cover the same topics talked about in this
article? I'd really like to be a part of community where
I can get comments from other experienced people that share the same interest.
If you have any recommendations, please let me know. Thanks!
https://communities.sas.com/