When data meets geography, use cases revolve around mapping and spatial analytics. But what happens when you combine digital analytics and powerful visualization for customer location analysis?
Leveraging data collection mechanisms, SAS 360 Discover captures first-party behavioral information across the entire digital customer experience with a brand’s websites and mobile apps. As semi-structured raw clickstream data flows into the system, SAS transforms that valuable information into structured views to accelerate analysts in deriving insights on customers, not sessions or hits. If that short appetizer on SAS 360 Discover captured your interest for more details, check out this primer.
When someone visits your website, they leave a data trail ripe for location analysis. Attributes related to their latitude, longitude, city, state, country and more are part of that glorious digital data stream that your brand uniquely owns. To maximize one’s ability to extract insight, SAS provides SAS Visual Analytics as the analysis tool for SAS 360 Discover. Users can combine traditional data sources (transactional, customer, digital, etc.) with location data for analysis in a geographical context.
Let’s dive into an example. The use case will be:
How can SAS raise awareness of technology training in a specific geographic area?
Let’s begin with a visualization that summarizes website visitors to sas.com globally in a specified period.
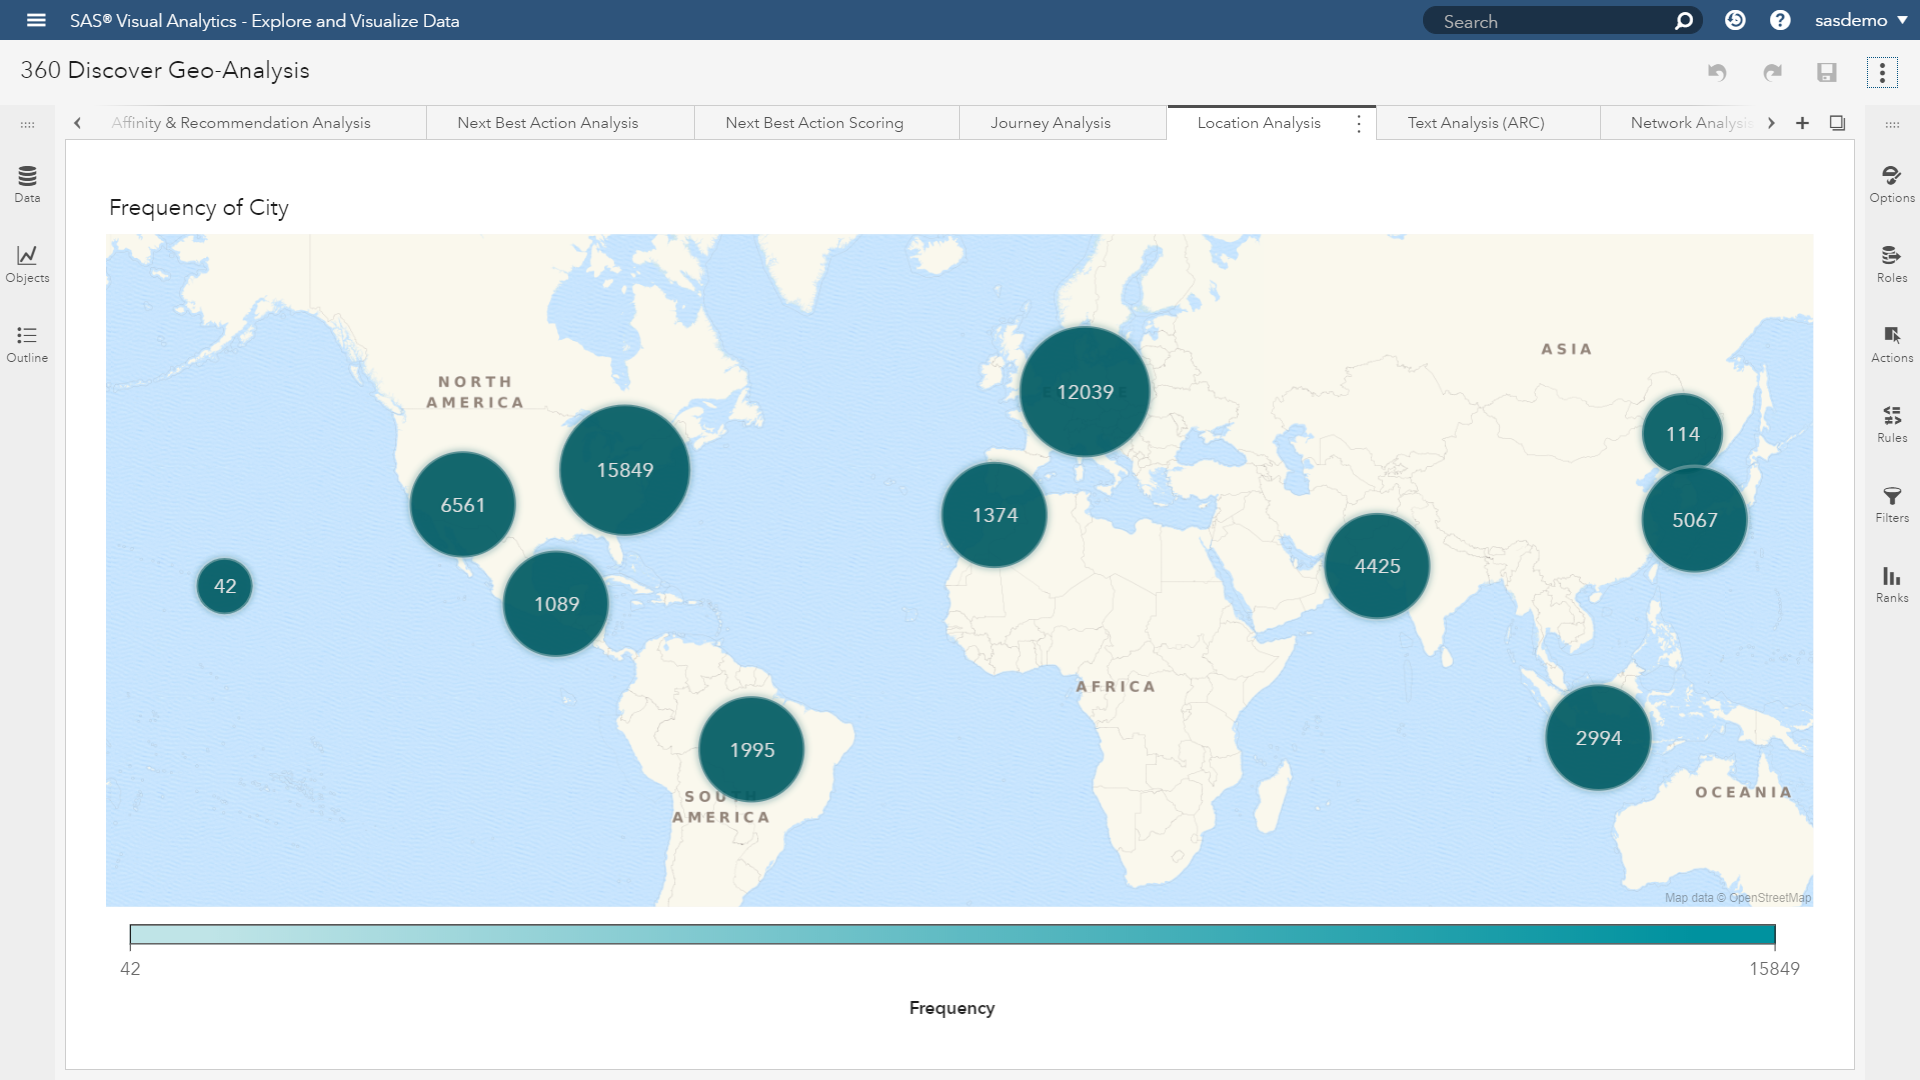
SAS Visual Analytics uses built-in clustering algorithms to determine cluster nodes given the geographical location of the underlying data. This is what determines the groupings of site visitors in the visualization above. Users have options to adjust clustering given their preferences, such as the maximum number of clusters or the desired spacing. The clustering will re-run automatically as you navigate in the map.
Although SAS has training centers all over the world, I want to drill down into a specific location at SAS headquarters in Cary, North Carolina.
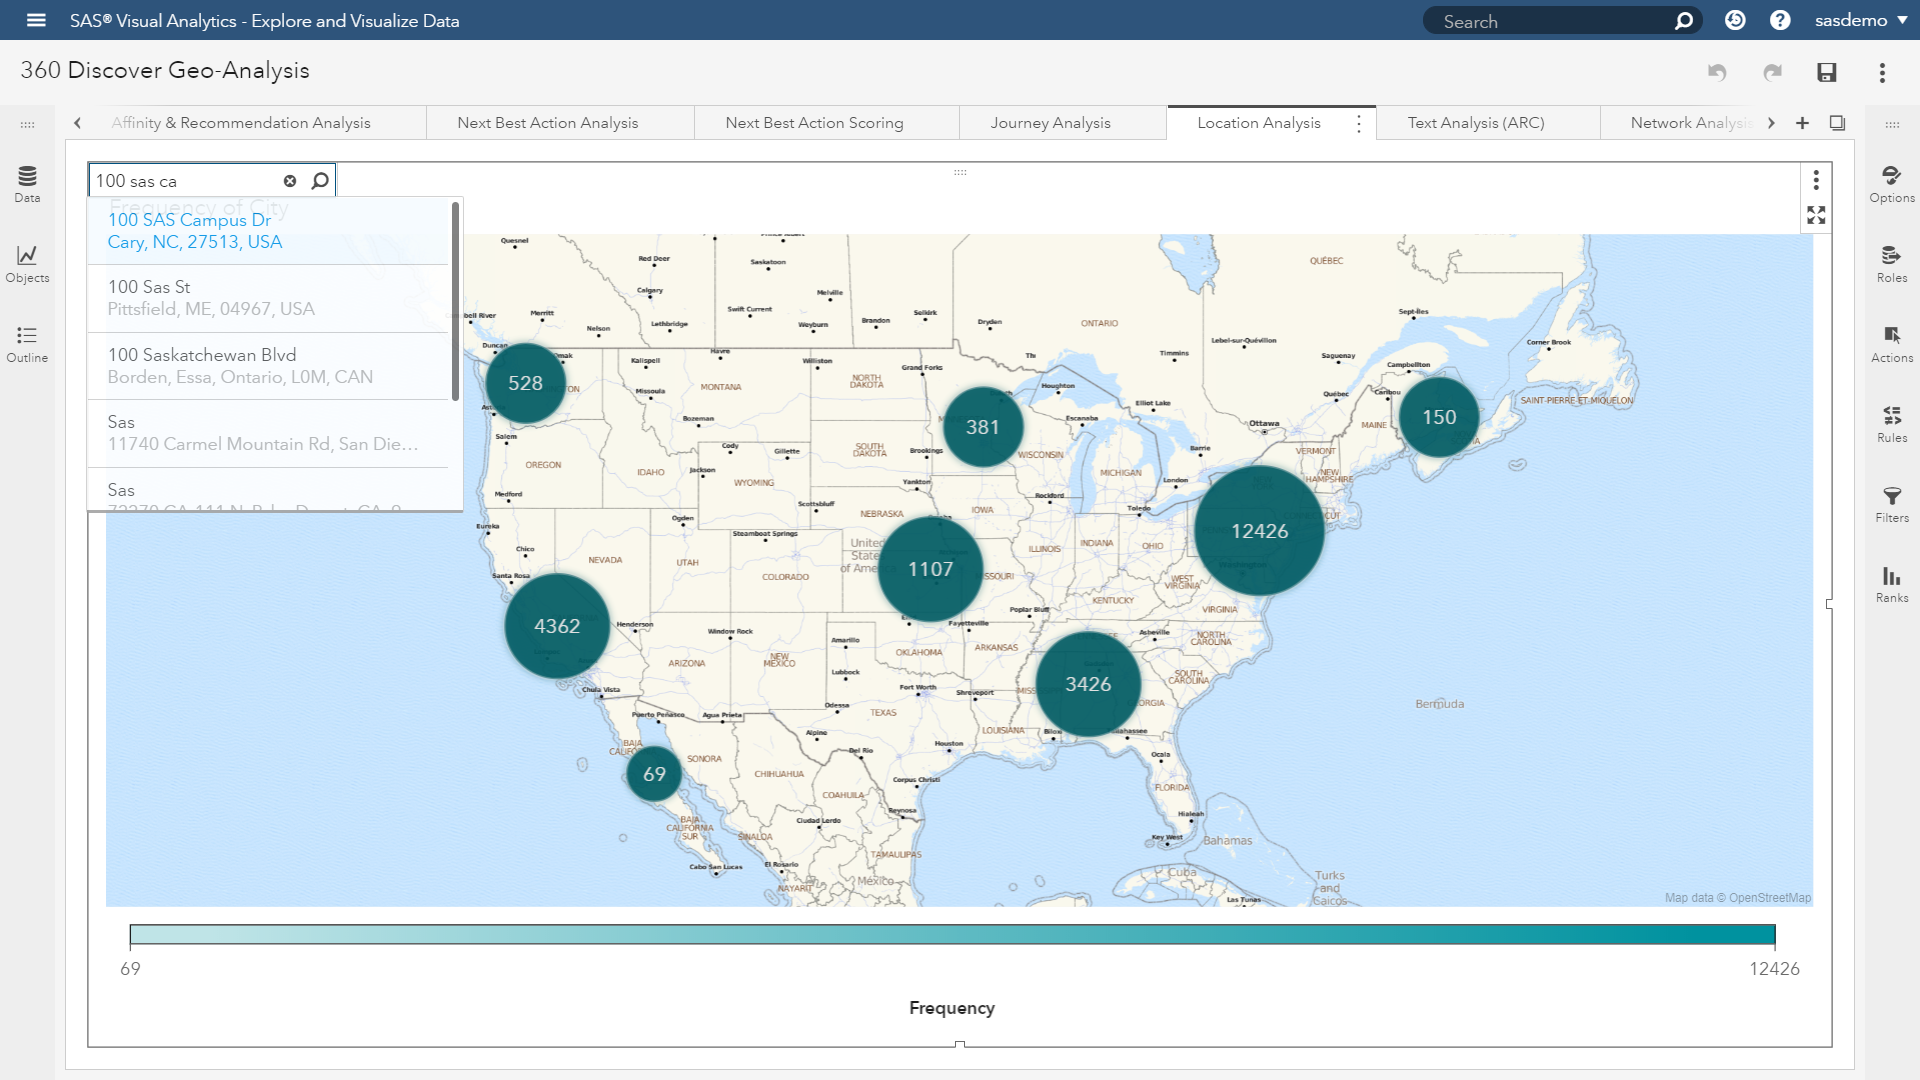
The built-in search facility helps to quickly allow users to specify a location. As I’m entering the address for SAS headquarters, suggestions will be shown with matching locations. Selecting one of the suggestions will add the related point-of-interest to the map.
Now let’s see how many website visitors are within a 30-minute drive time of the SAS training center at 8:00 am on Mondays.
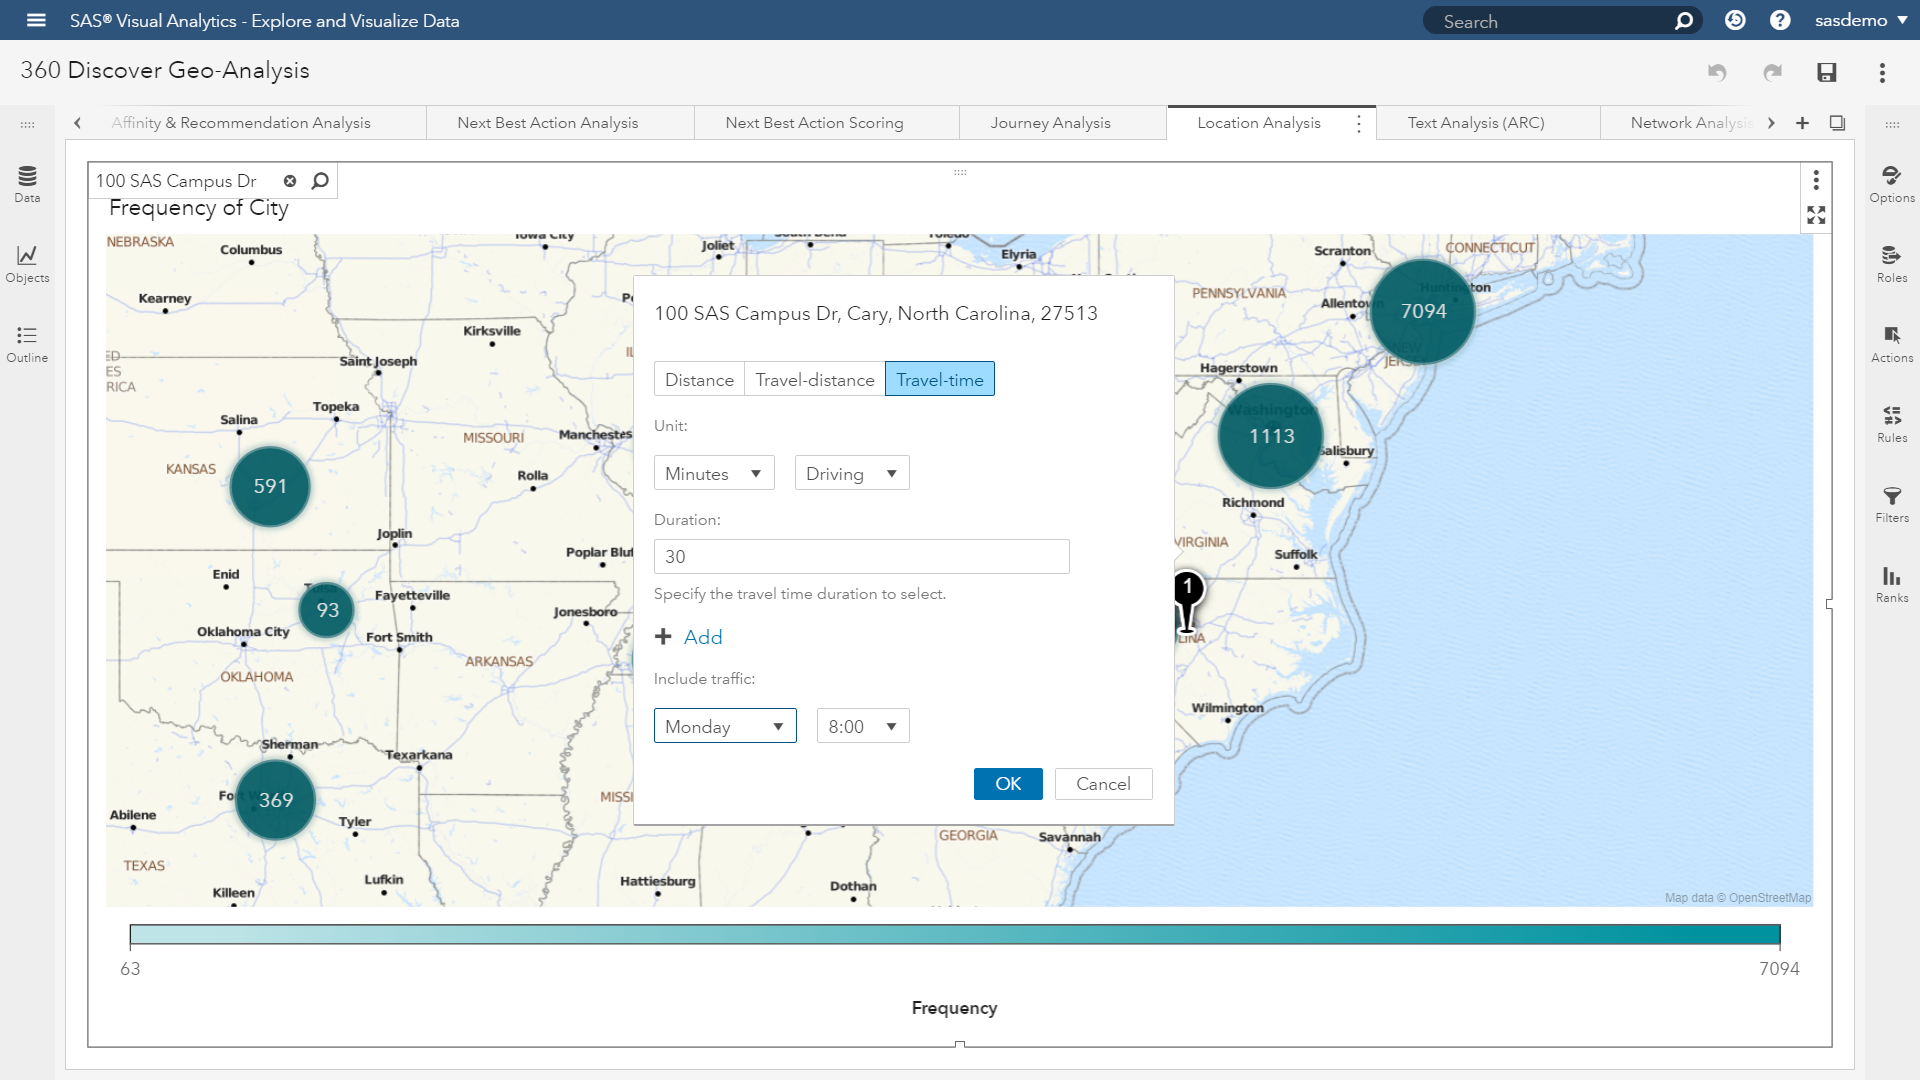
Since we have the exact training center location, we can calculate the distance and see how many website visitors live in close proximity. Users have options to either calculate the actual distance based on the type of travel, such as driving or walking, or perform the analysis given the time it takes to travel.
Based on the day of the week or time of day – traveling to and from the training center may take significantly longer. SAS Visual Analytics allows users to include typical travel times, as well as live traffic. So, let’s find out which website visitors (highlighted in the blueish-green circles) can make it to the training center in 30 minutes or less on a typical Monday morning.
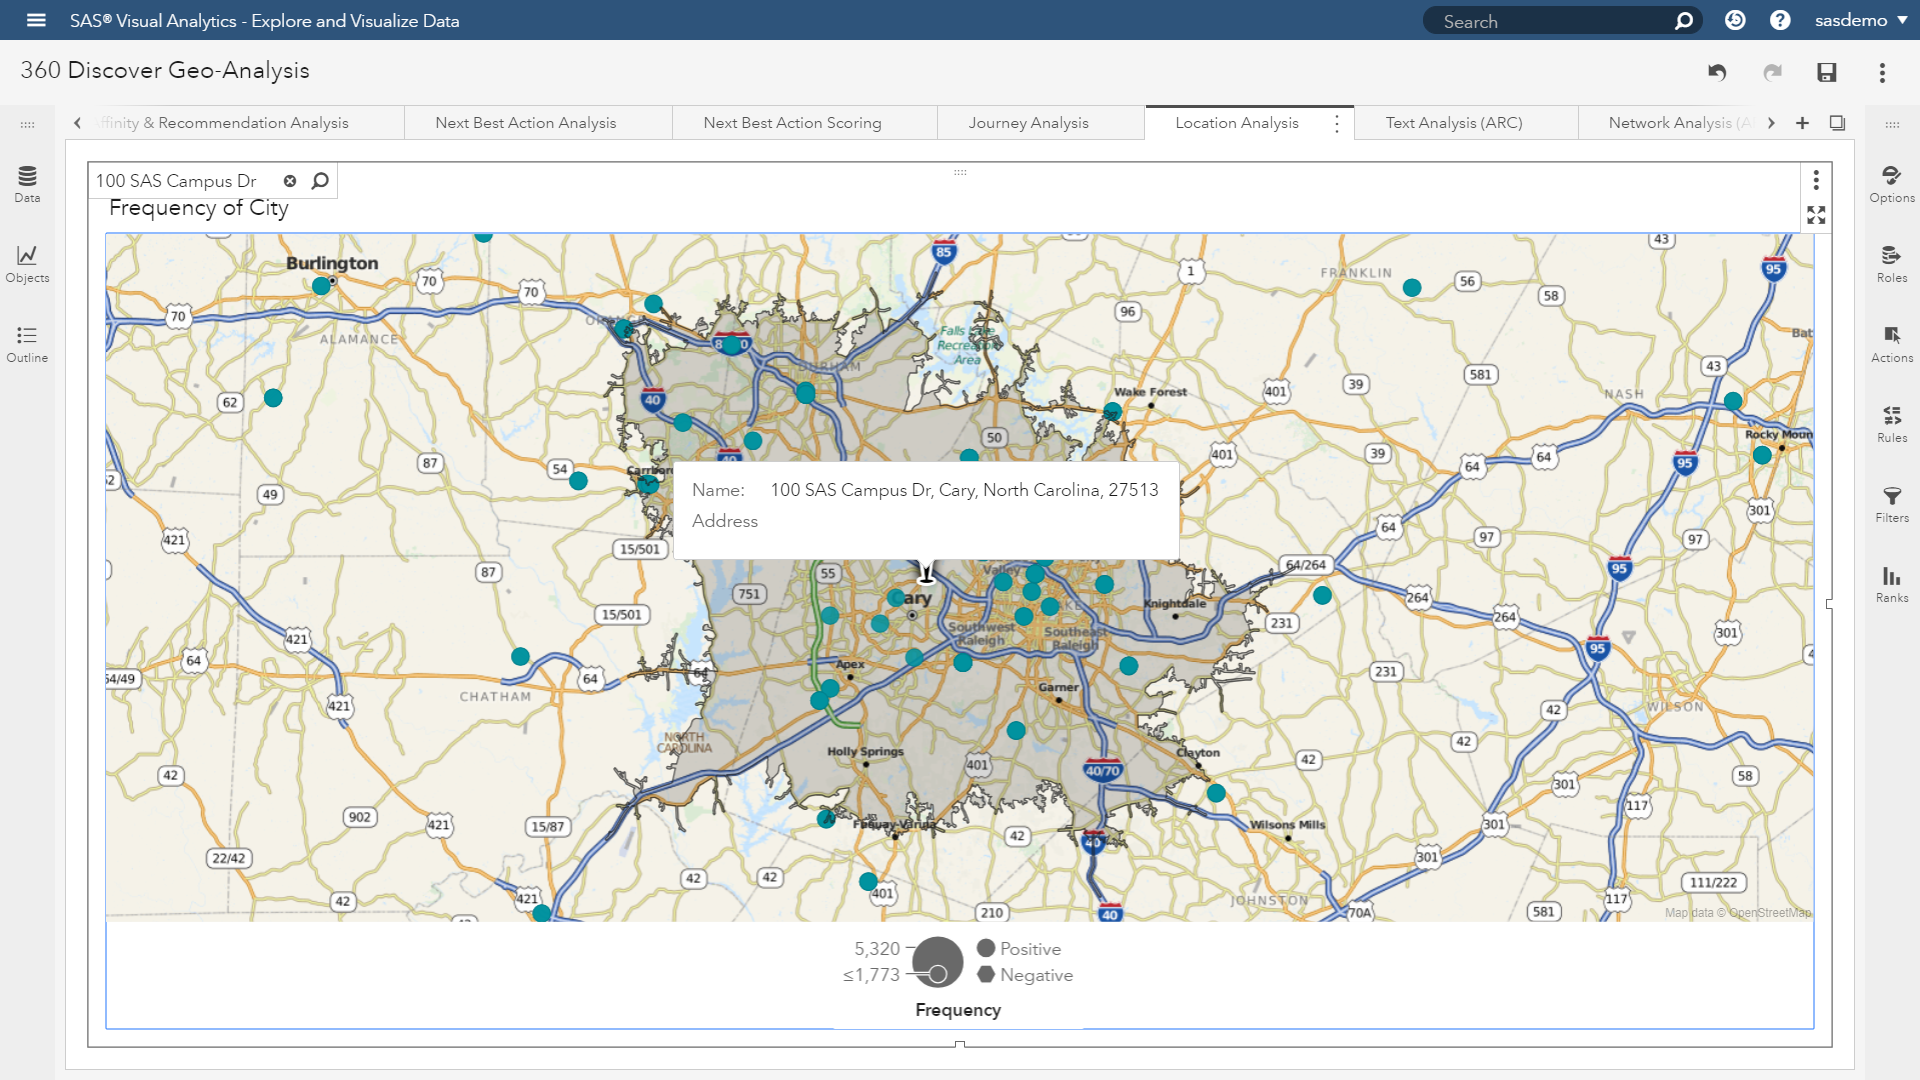
Executing this location analysis shows the expected polygon around the training center. The shaded area indicates the prospects to which SAS could advertise an upcoming training class.
Let’s dream bigger!
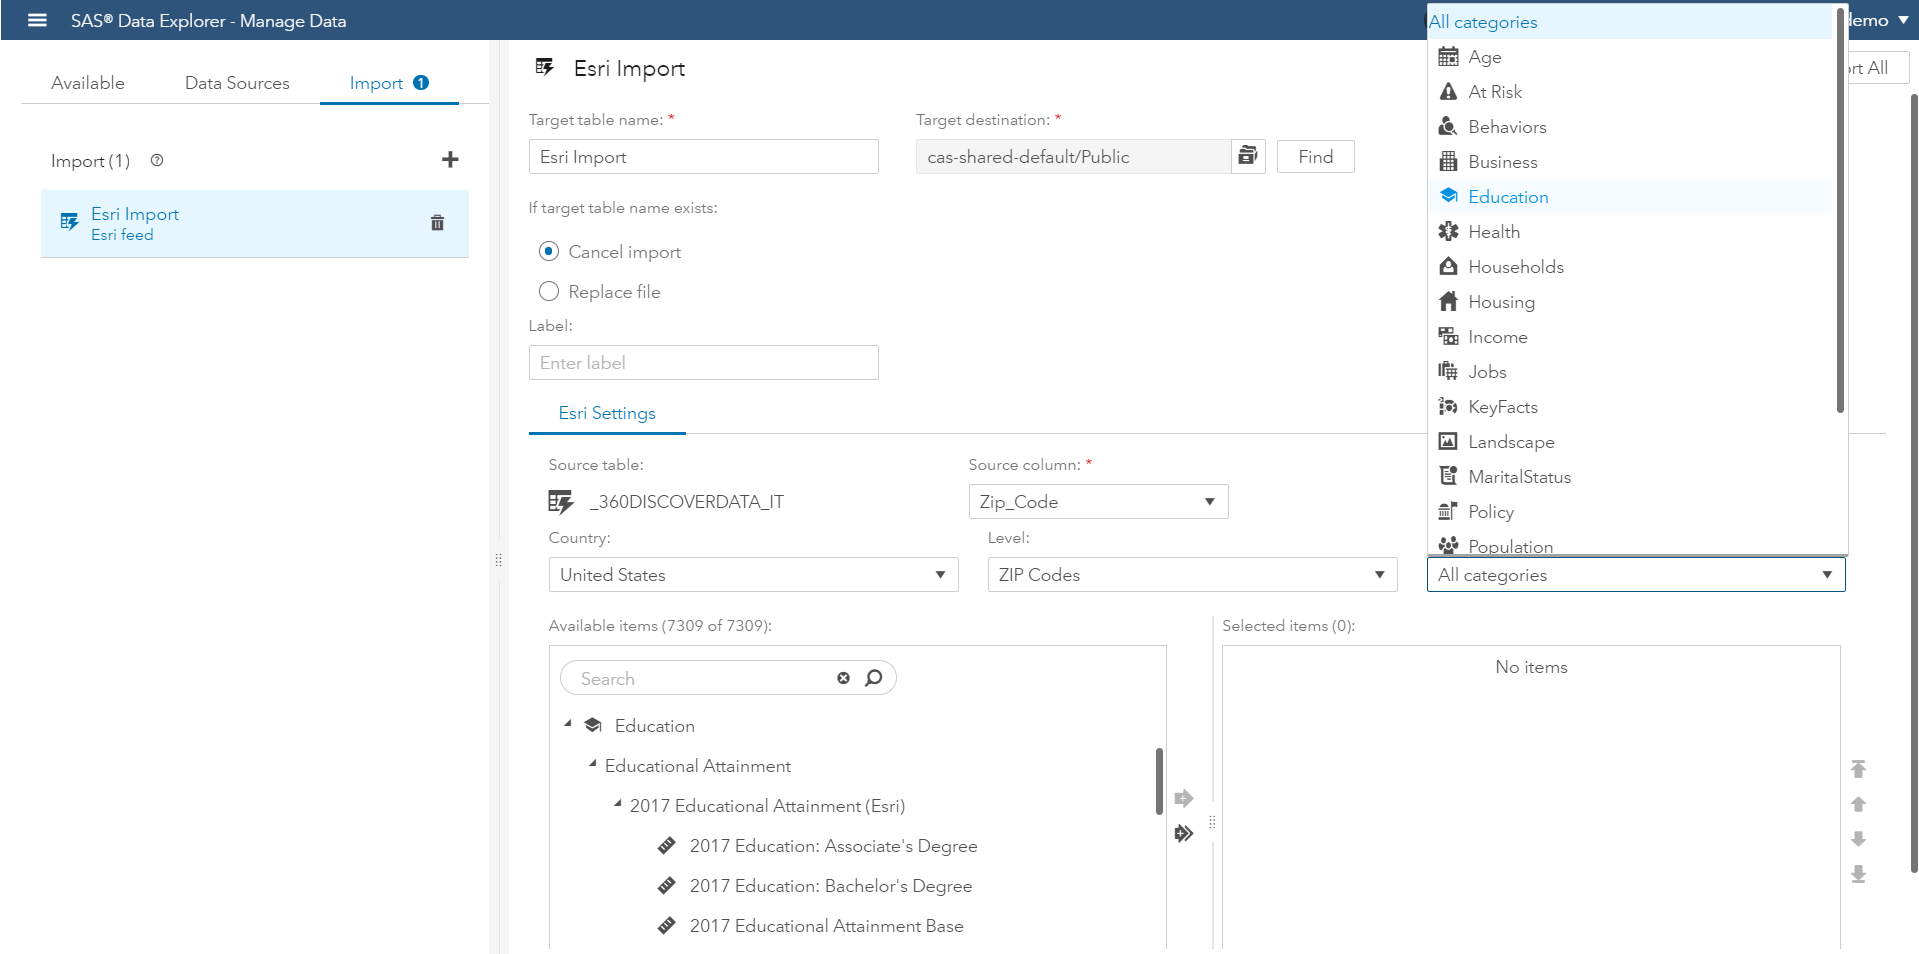
Thus far, we have been leveraging the valuable first-party data collected by SAS 360 Discover from sas.com. However, I can go one step further and overlay third-party data (in this example, our integration with ESRI) to attain additional insight about the specific geographic area.

With a wealth of demographics and psychographics available at my fingertips, I simply want to identify how many individuals in this geographic area have acquired a graduate degree. Although I could overlay additional criteria, I choose to stop here because my hypothesis is individuals with this profile attribute will have a correlated interest in what classes SAS offers.
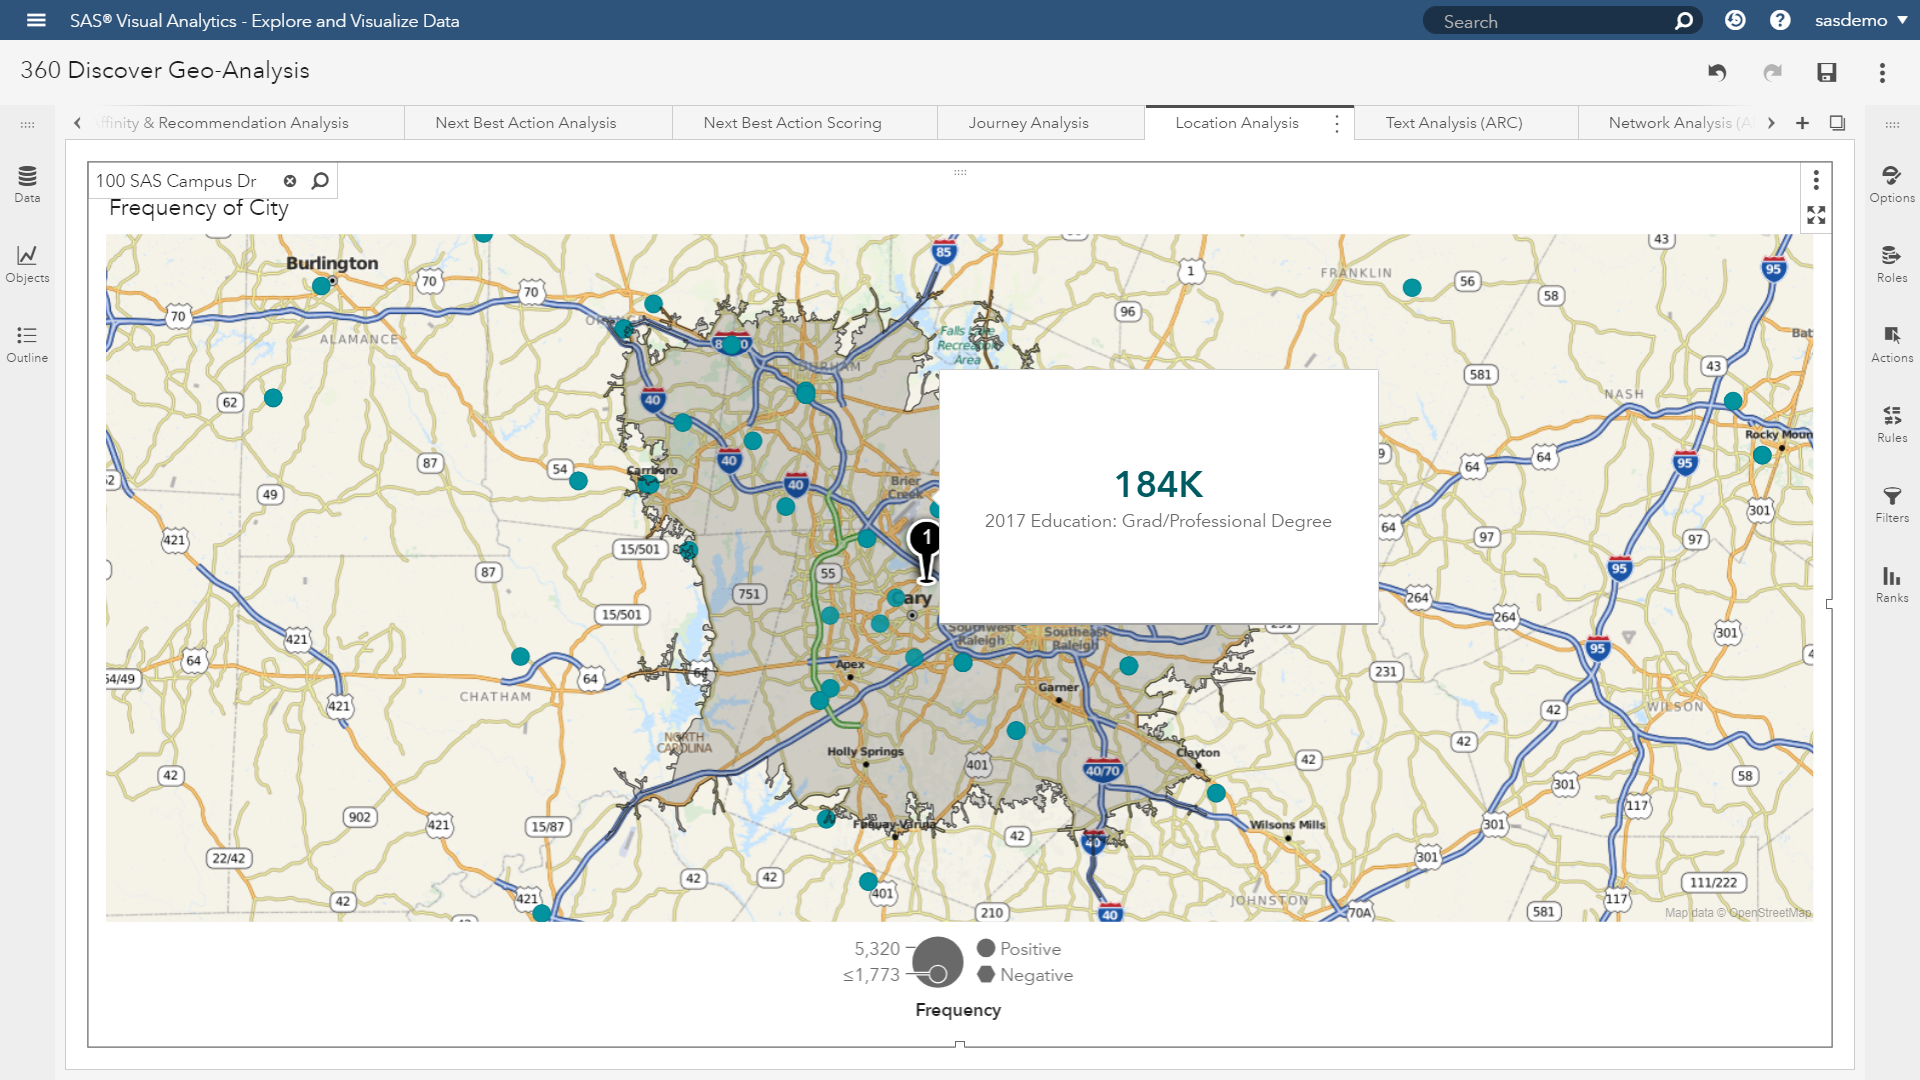
Wow! The potential marketable population outside of direct visitors to sas.com is approximately 184,000 prospects for the Cary, North Carolina training center. Although we are focused on individuals who have directly interacted with the brand, insights derived could be shared with future lead generation and acquisition campaigns to target this broader population.
That was interesting. But how do we take action?
This is where the rubber hits the road. Let’s begin with isolating the audience.
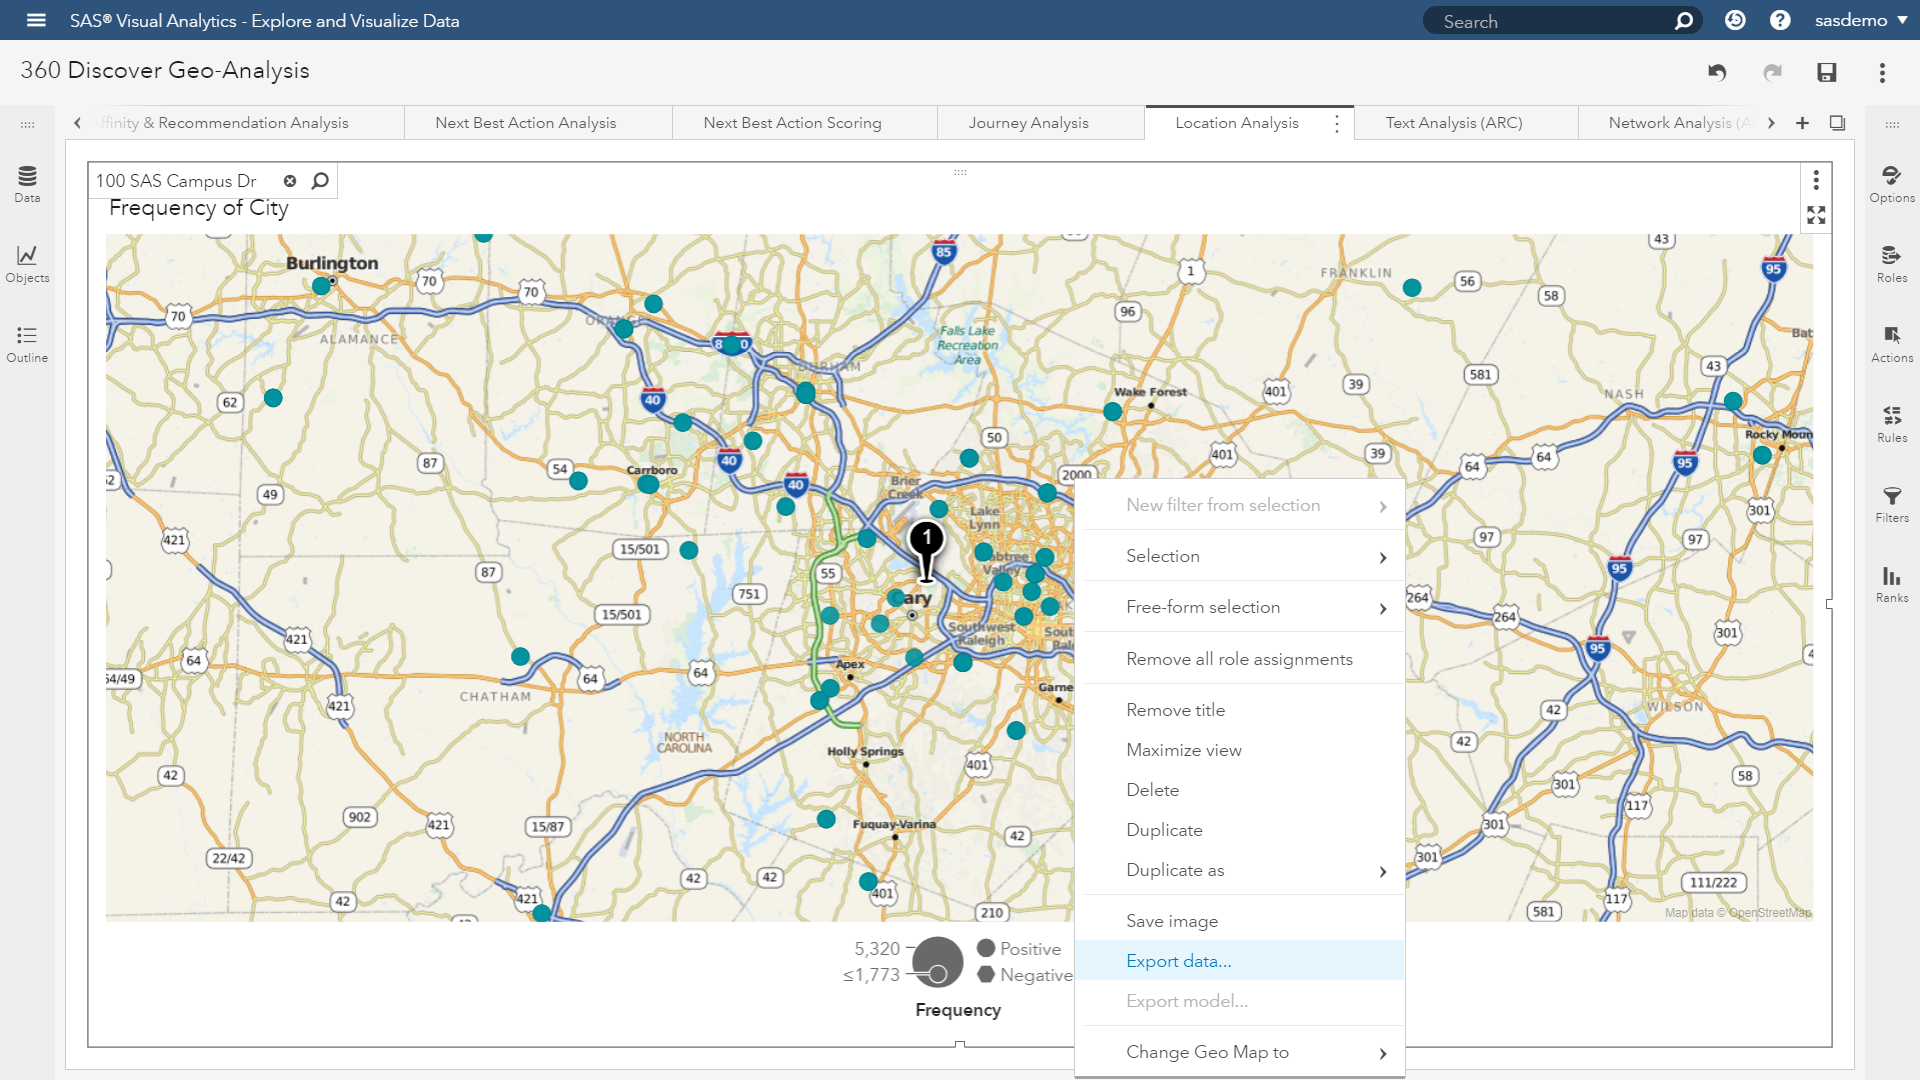
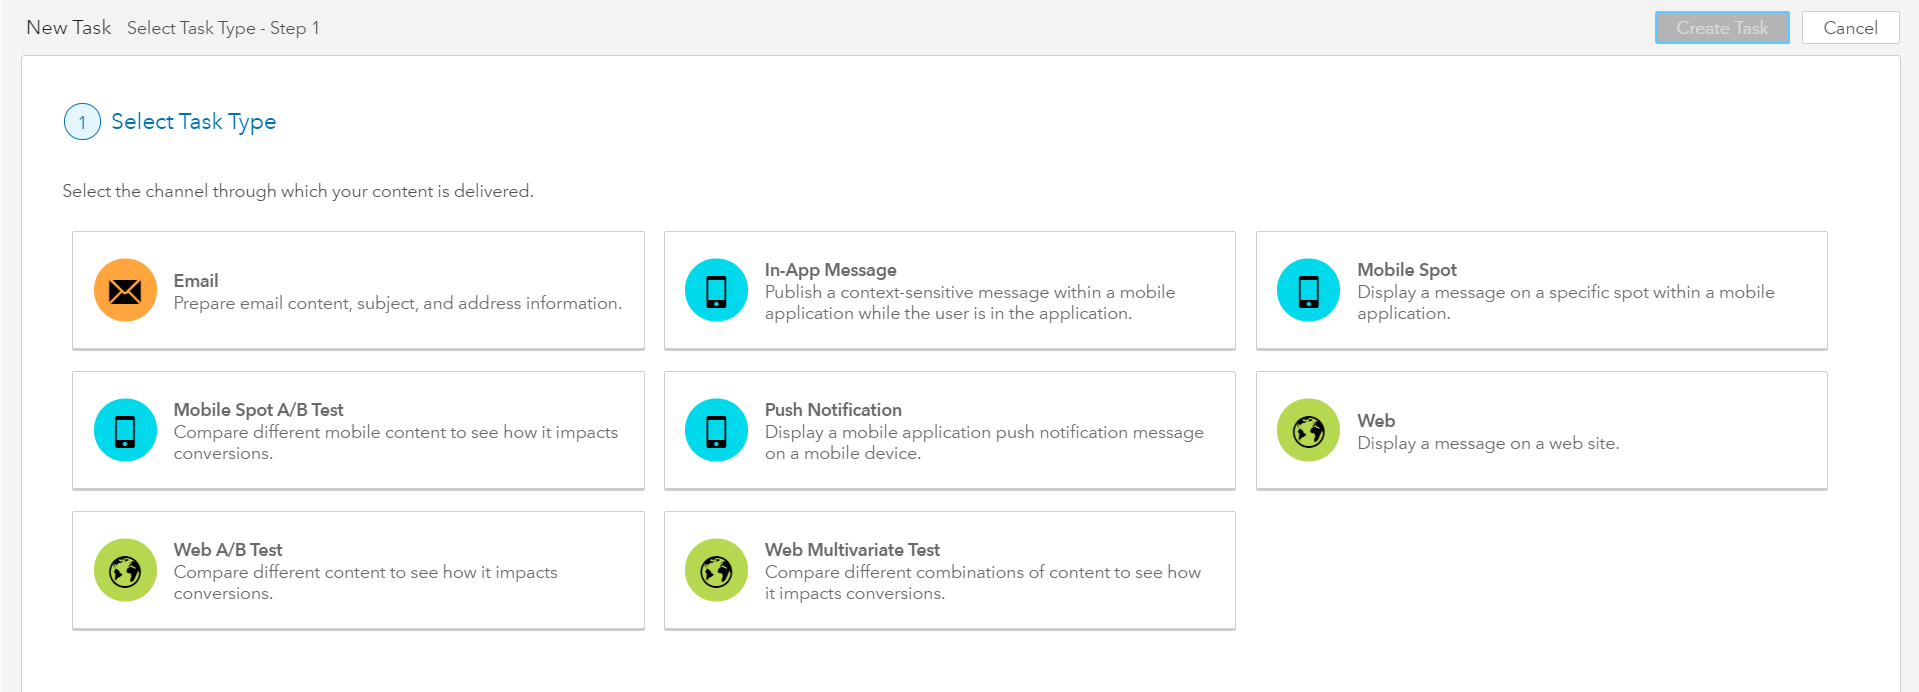
By having the ability to export the audience selection, users can now share this valuable segment for marketing interactions. For example, SAS 360 Engage can target this audience across a variety of digital channels, whether it is web, mobile, or email. We can leverage different flavors of testing, and optimize our communications strategies within this local geographic market.
Wait a minute. This is SAS – where can we apply richer analytics? Don’t stress. Users can define filters from mapping selections, and then leverage other features in Visual Analytics specifically applied to the filtered audiences. For example, here is a great sports industry use case that leverages both geo-analysis and analytical clustering for the purposes of ticket sales and segmentation.
Moving past the sports example, it is important to highlight that users of SAS 360 Discover can augment first party website visitor data with third-party inferred data related to a variety of categories.
Once your data is ready, users can dive into a variety of analyses to slice, dice and perform powerful flavors of prediction like decision trees, forests, gradient boosting, or neural networks.
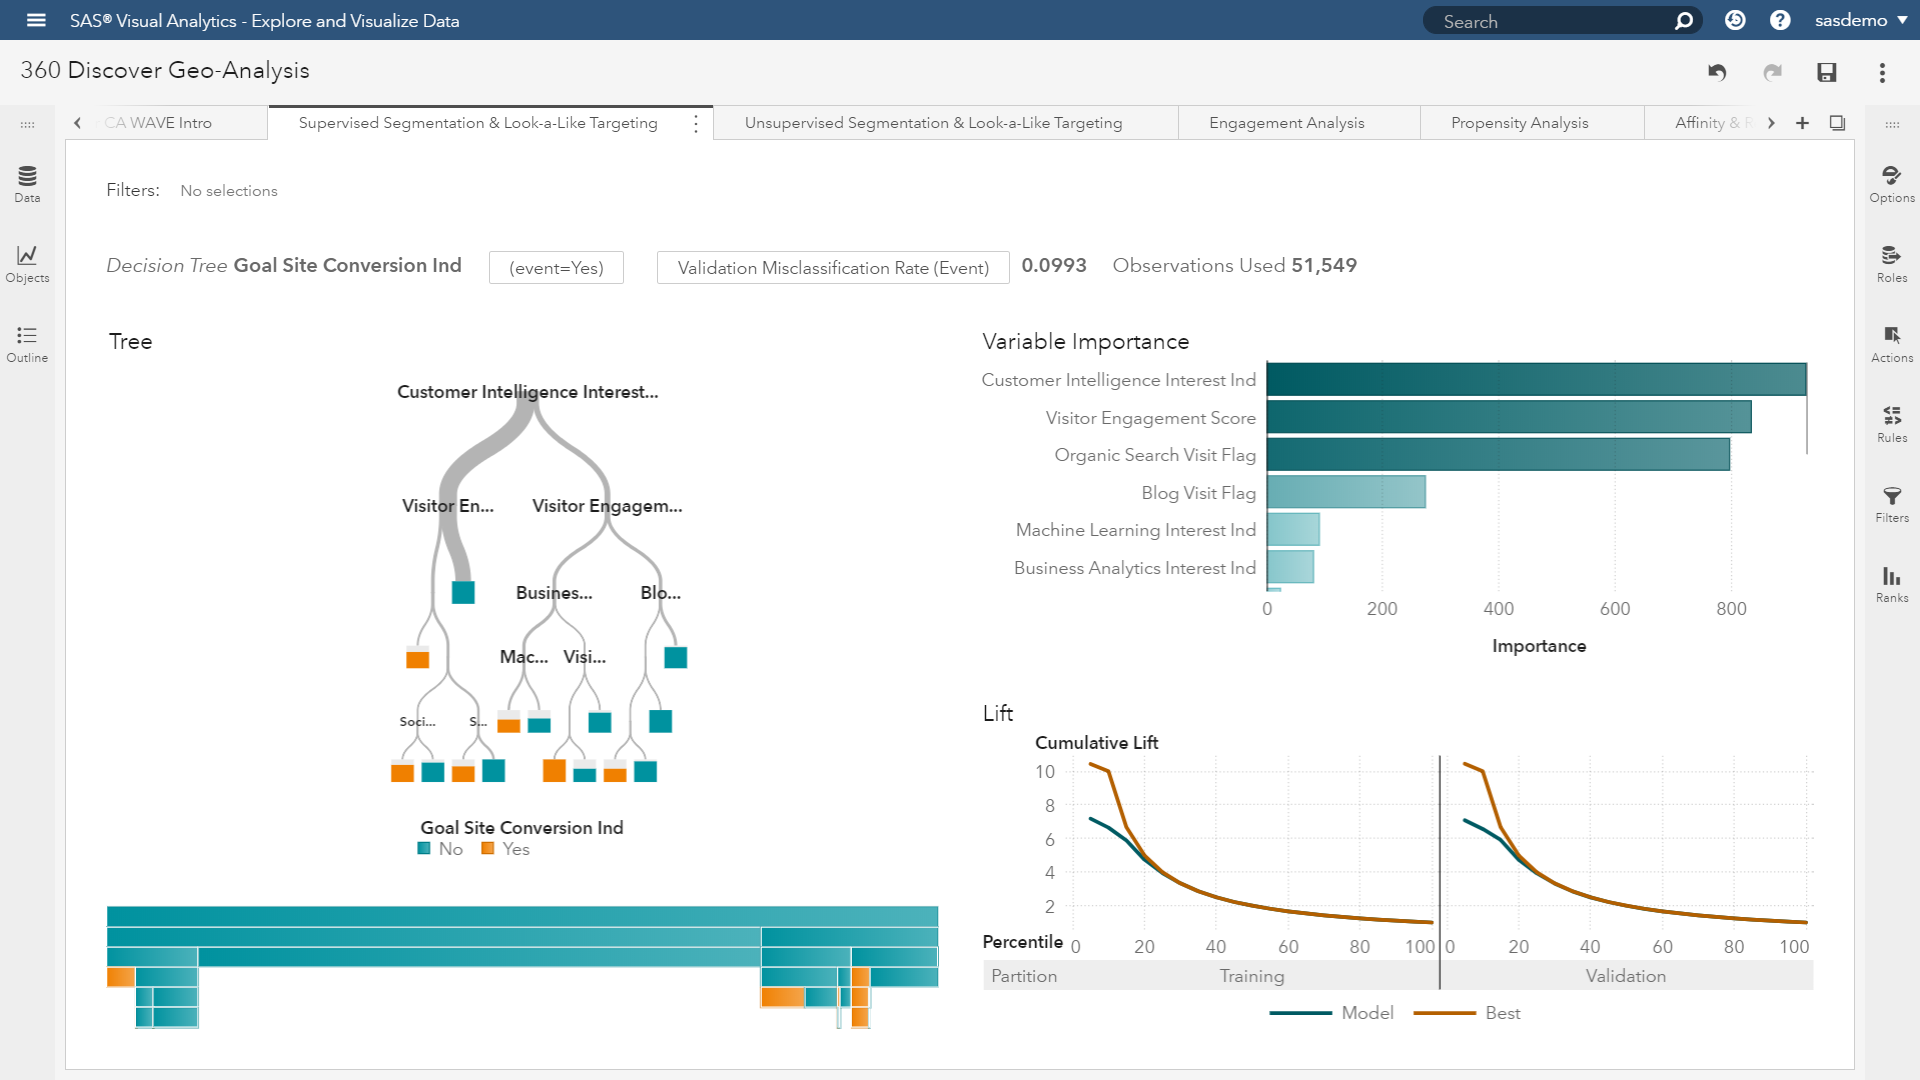
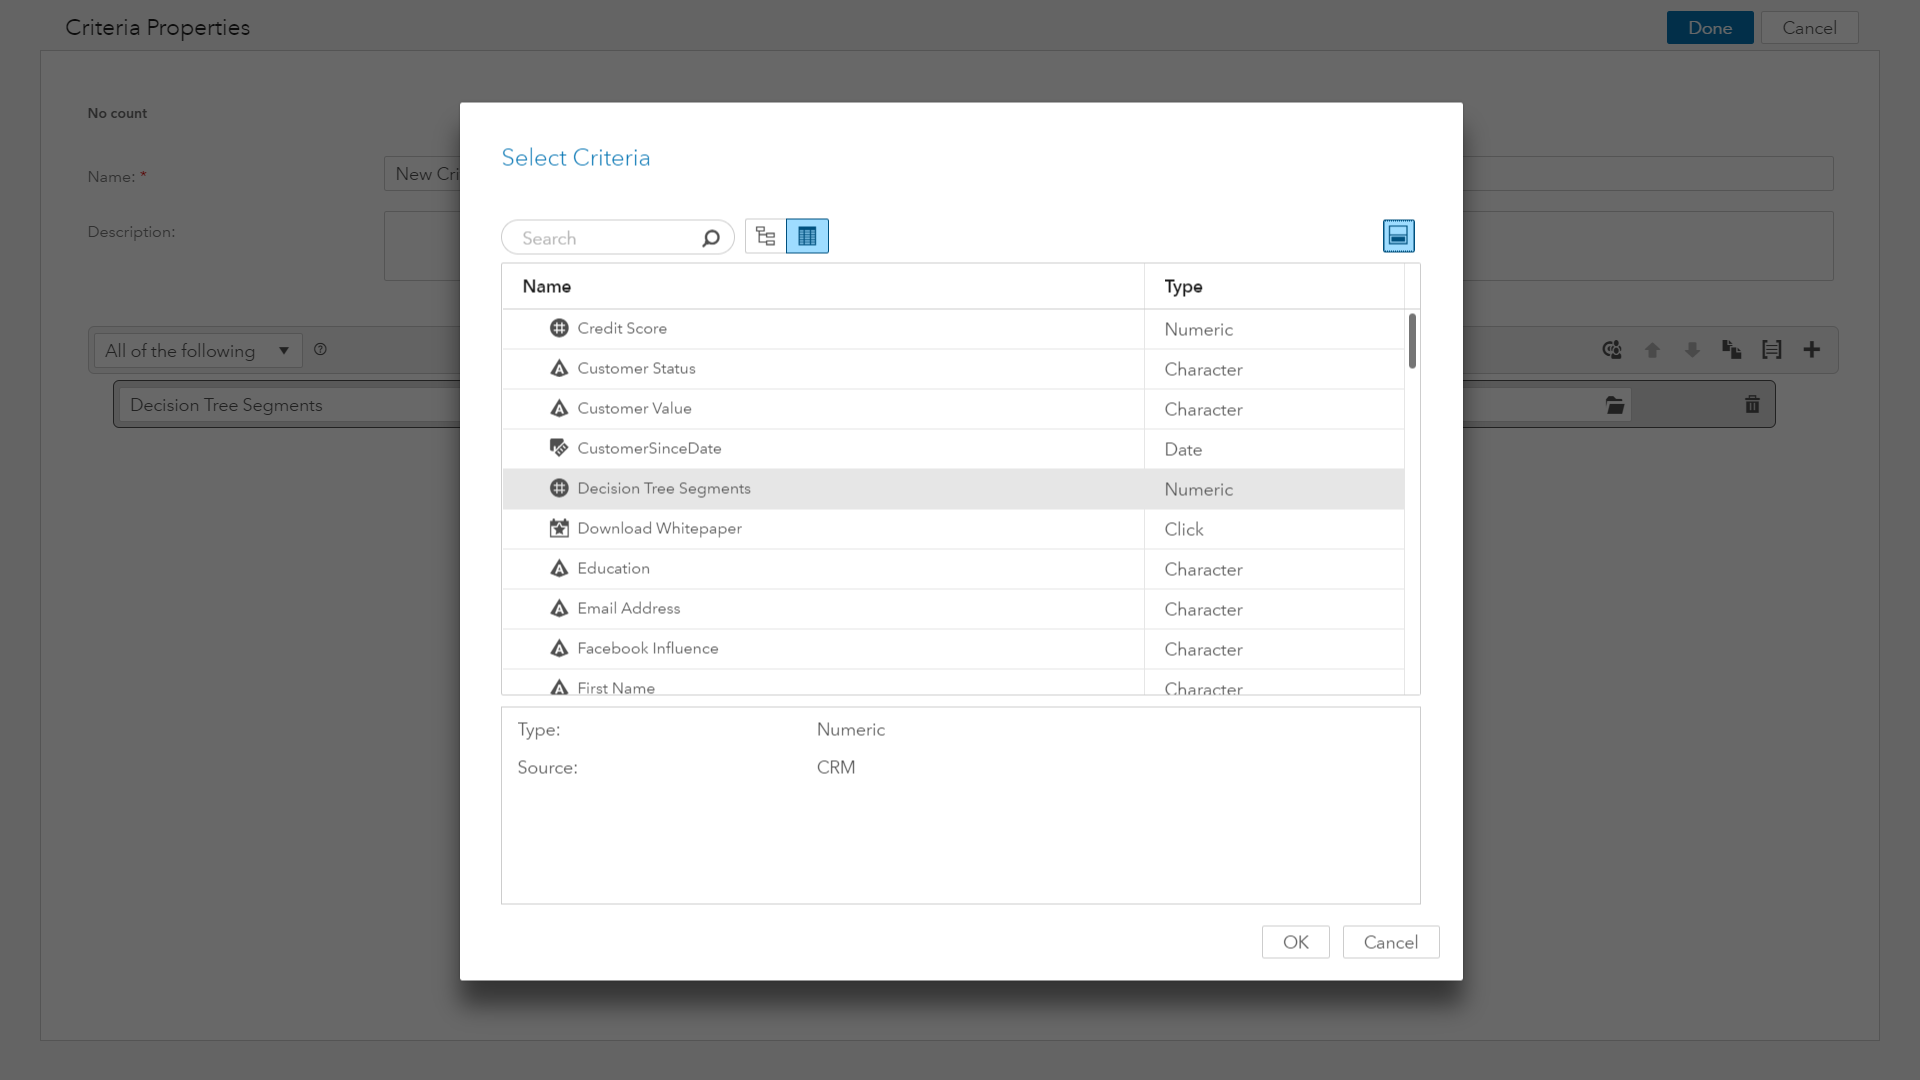
But no matter what your algorithmic weapon of choice is, you’ll need data that you can action against. And if a propensity score adds value to your nested targeting schemes for campaign management objectives, marketers should be able to leverage analytic insight just as easily as any other piece of first- or third-party data.
Customer journey management, varying views of data, stepping up your analytics game or taking action with geo-personalization - these shouldn’t be barriers anymore in 2018!