In Part 1 of this blog posting series, we discussed our current viewpoints on marketing attribution and conversion journey analysis in 2017. We concluded on a cliffhanger, and would like to return to our question of which attribution measurement method should we ultimately focus on. As with all difficult questions in life, the answer is: "It depends." A typical attribution report on its own won't answer the question. And it doesn’t matter if the attribution report is generated using the most sophisticated algorithmic techniques. There are four things that the report doesn’t tell you:
- The elasticities of a single touchpoint.
- The interdependencies between different touchpoints.
- Cause and effect and timing dependencies.
- Differences between different groups of customers.
Touchpoint elasticity
The traditional approach to putting attribution results into action assumes a positive relationship between channel or touchpoint spending and conversion credit. This is the logic that leads a marketer to conclude that they should divert resources towards better performing touchpoints – double spending on something big will make it much bigger because doubling spending on something small will only make it a little less small.
Whenever we talk about elasticity – price, response, supply and demand – we usually think of a curve that looks like the green line below. This comes from experience of modelling many economic scenarios. What it is telling us is that you need to spend at least a certain amount to stimulate demand, but that there is also a point where the law of diminishing returns applies.
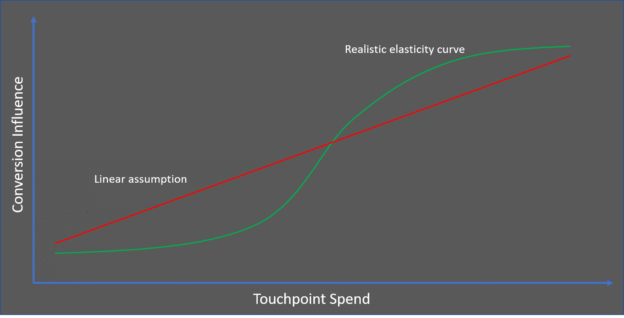
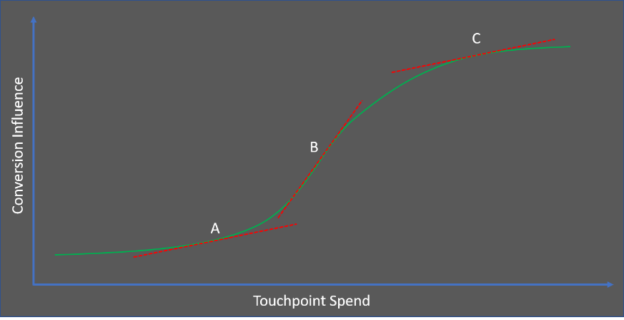
On the other hand, marketing analysts tend to assume that the red linear model fits, which isn’t the case (except as an approximation over a small region). And what you can't tell from the results of an attribution analysis is where exactly current investment levels lie on the green line. Ideally, you would want to be somewhere in the region of point B in the graph below because you know that the impact of any increased spending would be greatest. Knowing that you are at point A tells you need to invest significantly more to see a benefit, whereas any additional spending is wasted at point C (and may even be detrimental, though this isn’t shown on the graph).
Successful attribution analysis currently requires an iterative approach to determining the best actions and discovering the shape of the response curve.
Touchpoint interactions
With a limited investment pot, there is always going to be competition between different marketing activities and touchpoints. Thus, the more you spend on one channel, the less you can spend on another. However, here we are talking about the influence that one channel has on another.
We can all visualize a scenario where a user receives a viewable impression of a display media ad, and subsequently searches for the advertised product – perhaps because they remember seeing the ad. In another scenario, the user receives a promotional email and then later that day, clicks on a social media ad for that specific product. In both cases, there is a question as to how much the first activity influenced the second and how to accurately measure this.
Cause and effect
Does the sequence of ad media impressions matter? Does one act as a warm-up for the other and, if so, what is the optimal timing between the two? This is the area where attribution and customer journeys meet. What are the common sequences of activity that drive conversion. How can these be influenced? And how does this compare with how the organization thinks that a customer interacts with them? Of course this only holds for touchpoints that can be measured.
Customer dependencies
Can you realistically apply a single attribution model when you have distinctly different groups of customers (or segments)? Assuming homogeneity simplifies the analysis (but might come at a cost of missed opportunities). Plus, a single user does not always present him or herself with a consistent way. They may have different objectives on subsequent visits, or even multiple objectives in one visit.
Uncovering those differences is also informs the customer journey analysis. The idea that all these pieces of information inform strategic planning and day-to-day operational marketing activities is gaining traction across many of our customers.
The SAS Customer Intelligence 360 approach
We are delivering on our vision of artificial intelligence-driven customer journey optimization. The first step is attribution and journey path analysis that uses historical and current information to build representations of what the future might look like. It is an exciting topic, and one that requires technical know-how, as well market acceptance of the perceived loss of control over individual decisions. It will not happen overnight, so we are pacing ourselves and releasing a set of capabilities that build toward that future state.
In Part 3 of this series, we will share our aims, rationalization and new capabilities within SAS Customer Intelligence 360 for handling algorithmic marketing attribution and conversion journey analysis.
This blog post was authored by Malcolm Lightbody (SAS Customer Intelligence Product Management) and Suneel Grover (SAS Principal Solutions Architect).