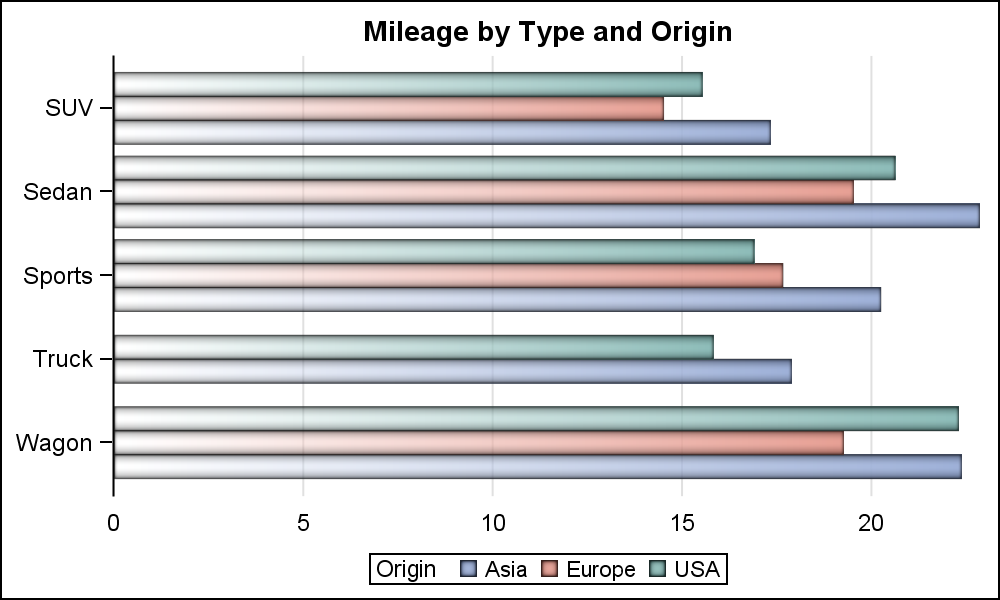
Search Results: grouped bar chart  (51)

Data Visualization
Dan Heath 0
Area Bar Charts using SGPLOT

The SGPLOT procedure supports a wide variety of plot types that you can use directly or combine together to create more complex graphs. Even with this flexibility, there might be times you run across a graph that you cannot create using one of the standard plot types. An "area" bar

Data Visualization
Sanjay Matange 0
Fun with Bar Charts

As Sheldon Cooper would say, this is the first episode of "Fun with Charts".  I did not find a cool term like "Vexillology" and "Cartography" is taken by map making, so let us go with "Chartology". Yesterday, I saw a couple of interesting bar charts as shown on the right.  I thought

Data Visualization
Sanjay Matange 0
Grouped Timeline

Recently, a user posed a question on how to plot stacked frequencies on a time axis.  The data included frequencies of different viruses by week.  The data is modified to preserve confidentiality and is shown below. The user's first instinct was to use a bar chart with stacked groups.  This works for automatically computing frequencies

Data Visualization
Sanjay Matange 0
Percent VBar

Recently a reader chimed in with a question on the Do Loop article by Rick Wicklin on how to create a bar chart with percent statistics.  Rick used SAS 9.3  and the reader wanted to do the same with SAS 9.2. For the basic (non-grouped) bar chart, the process is the

Data Visualization
Sanjay Matange 0
Butterfly plots

When comparing results by category and group,  putting the items to be compared close together usually leads to a graph that is easier to decode.  Take the case of the data (simulated) shown below. Here we have population by age group and sex.  To compare the population by sex, it is

SAS Events
Sanjay Matange 0
Graphs are easy with SAS 9.3

ODS Graphics have matured.  With SAS 9.2, GTL and SG procedures were a new direction for creating analytical graphs in SAS. The motivation and design of the GTL framework and the SG procedures was driven primarily by the needs of the procedure writers within SAS to enable the automatic creation

Data Visualization
Sanjay Matange 0
Cluster groups

The topic of cluster groups comes up often.  By cluster group I am referring to the feature in bar charts where the group values are displayed side by side. With SAS 9.3, SG Procedures support stack or cluster grouping for Bar Charts and overlay or cluster grouping for all other

Data Visualization
Sanjay Matange 0
Dashboard graphs

In this blog we have been discussing graphs useful for analysis of data for many domains such as clinical research, forecasting and more.  SG Procedures and GTL are particularly suited for these use cases.  So, when I came upon a dashboard image from Steven Few's Visual Business Intelligence blog, showing the

Advanced Analytics | Analytics | Data for Good
Melanie Carey 0
Speed up your COVID-19 research with text analysis: step-by-step

Adverse outcomes, and the rapid spread of COVID-19, have accelerated research on all aspects of the disease. You may have found it overwhelming, and very time-consuming, to find relevant and specialized insights in all the scientific literature out there. To aid researchers in quickly identifying relevant literature about key topics

1 2