We asked Lars George, EMEA Chief Architect at Cloudera, to share his opinion about Hadoop, Big Data and future market trends in Business Analytics. For all those who want to know more about Hadoop we recomment this TDWI whitepaper and how to apply Big Data Analytics. The last few years
Search Results: Visual Analytics (1733)
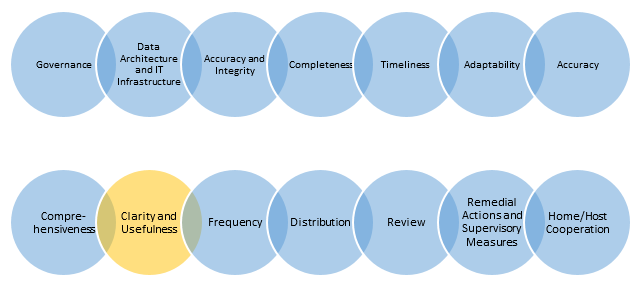
Principle 9: Risk management reports should communicate information in a clear and concise manner. Reports should be easy to understand yet comprehensive enough to facilitate informed decision-making. Reports should include meaningful information tailored to the needs of the recipients. While the data management and data aggregation principles have been heavily
Da war doch mal was, Sie erinnern sich, Hoodiejournalismus?! In dieser Diskussion über Digital gegen Print, jung gegen alteingessen, #hoodie vs. #schlipsy, über was ist Premium oder was ist hautnah dabei, über was erscheint modern, zeitgemäß und innovativ oder was bezahlt die Miete am Ende des Monats, ist ein Punkt
It was just a couple of years ago that folks were skeptical about the term "data scientist". It seemed like a simple re-branding of an established job role that carried titles such as "business analyst", "data manager", or "reporting specialist". But today, it seems that the definition of the "Data
Jill Dyché, internationally recognized speaker, author and business consultant, spends her days talking to businesses about big data – how they’re using it, challenges, successes, strategies, plans and more. What she’s hearing again and again from IT leaders is that they have to innovate with big data, move quickly and

In our hyper-connected world, information technology plays a key role in nearly every field and industry. Higher education is no exception, and that’s where EDUCAUSE comes in. This non-profit association works to advance higher education through the use of information technology. One of the primary ways EDUCAUSE achieves its goal
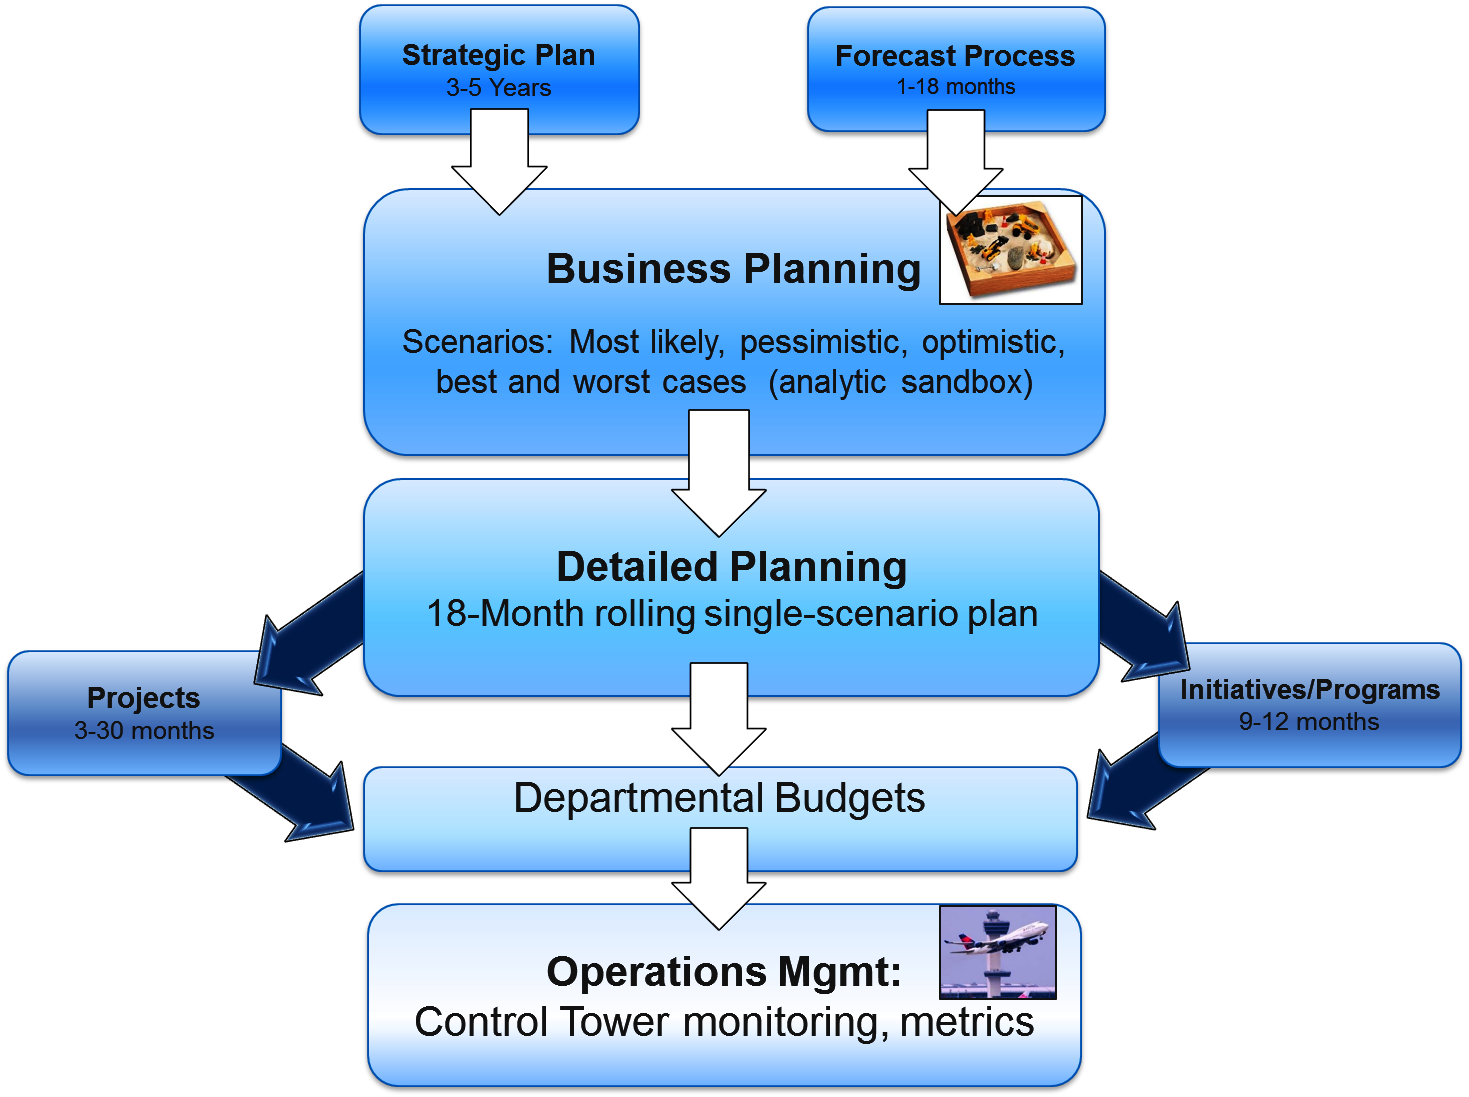
Analytics gives us not just the ability but the imperative to separate our planning activities into two distinct segments – detailed planning that leads to budgets in support of execution, and high-level, analytic-enabled business/scenario planning. My critique of Control Towers in this blog last time led me not only to
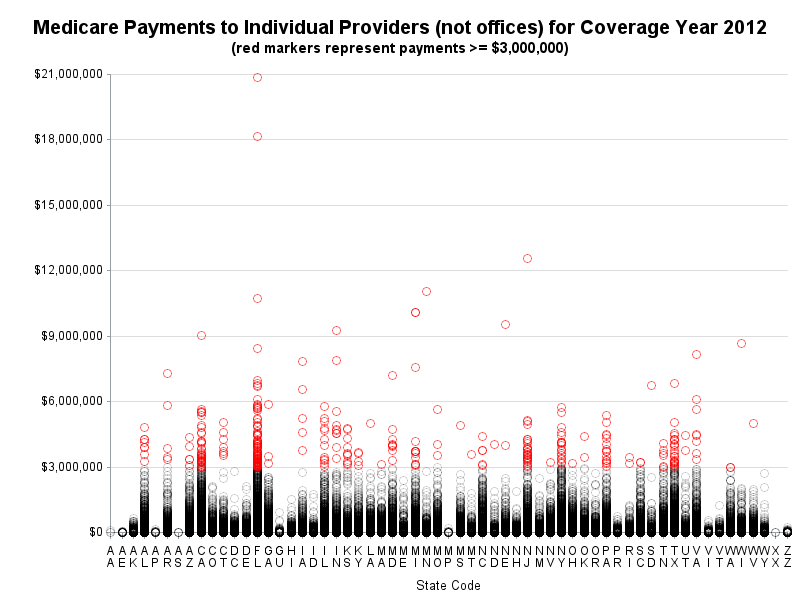
Would you like to analyze the 9 million lines of Medicare payment data that was recently made public? You'll need lots of luck if you're planning to use Excel ... whereas this is the kind of thing SAS was built for! Here's a sneak-peek at what the text data looks

The volume is being turned up on the Control Tower approach to running a business; I have recently been introduced to logistics control towers, supply chain control towers and operations control towers just for starters. I’m sure there must be at least a half dozen more out there – pick
Sometimes you have to get small to win big. SAS Data Management breaks solution capabilities into smaller chunks – and deploys services as needed – to help customers reduce their total cost of ownership. SAS Master Data Management (MDM) is also a pioneer in "phased MDM." It's built on top of a data
I'm sure that anyone in the world would do whatever they could to help find the missing Flight 370 ... and this is my attempt to do what I can. In my previous blog post, I showed how SAS could be used to visualize the locations where planes have disappeared. This blog
SAS Global Forum 2014 was a great success, with the SAS Studio, a web based SAS interface garnering a lot of attention. SAS also announced the availability of SAS Analytics U, providing free web based access to SAS analytics for students, faculty and researchers. The conference had multiple paper and Super demos on data
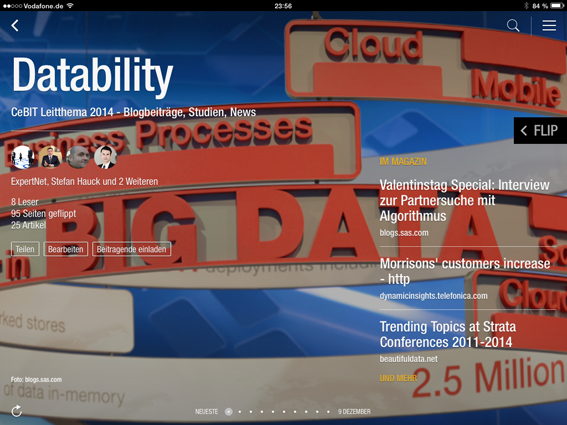
Viel zu lesen, aber wenig Zeit? Wenn es um das Leitthema der CeBIT 2014 geht, helfen wir hier: Ein Team von Experten stellt begleitend zur Messe, die aus ihrer Sicht wichtigsten Beiträge in einem Magazin bei Flipboard zusammen.

Nächste Woche steigt mit dem German CRM Forum die führende CRM-Konferenz in Deutschland. Nils Müller, CEO von TrendONE, hält die Keynote über „Meet your future customer“. Im Interview mit „Mehr Wissen“ spricht er über Innovationen, das CRM der Zukunft und Google Glass im Business-Alltag.

If you’ve been over to sas.com at all in the last week, you’ve probably noticed our relaunched site. The changes are kind of hard to miss. But it’s not just the home page that’s changed. And it’s not just a cosmetic redesign. The whole site has been revamped with a goal toward
Forecasting Support Systems (FSS) – essentially, decision support systems for forecasters – are being given increasing scrutiny in forecasting circles, including our recent half-dozen articles in Foresight. Additionally this year, there has been a special issue of the International Journal of Forecasting focused on the topic. Keith Ord and

Wow did the summer fly by! Now that grad school is over, it’s about time to resume the “it’s all about the data” series. In the last several posts, I tried to lay a foundation for understanding how SAS stores and manages data for use in business intelligence and analytic
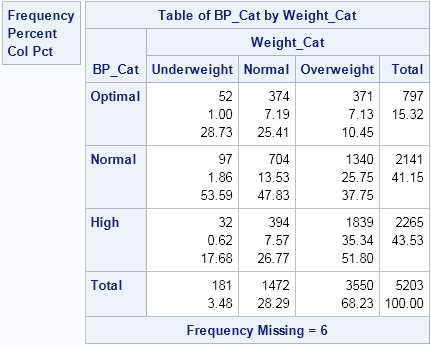
Mosaic plots (Hartigan and Kleiner, 1981; Friendly, 1994, JASA) are used for exploratory data analysis of categorical data. Mosaic plots have been available for decades in SAS products such as JMP, SAS/INSIGHT, and SAS/IML Studio. However, not all SAS customers have access to these specialized products, so I am pleased
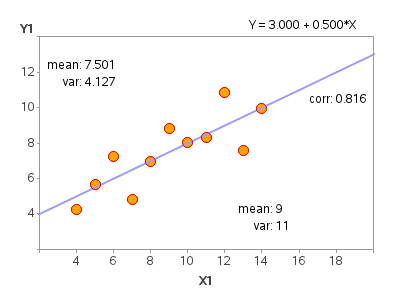
As you've probably guessed, I'm a "visual" person - I like to see things (in a chart/graph/map) rather than just reading about them (in a data table and summary statistic). Don't get me wrong - I'm a big fan of statistics and analytics -- but I'm an even bigger fan of

The National Academy of Engineering identified fourteen "Grand Challenges for Engineering" that must be addressed in order to achieve a sustainable, economically robust, and politically stable future. (see the full list here) The challenges are a call-to-action for solutions to some of the most pressing issues in the 21st century:

“Please Mr CEO, sir, can you find just a few brief moments in your busy schedule for a group of us humble and undeserving employees to discuss our strategic initiative to totally transform the company?” No matter what the topic or function, the one consistent element of every successful significant
Developing long-term, trusted business relationships doesn’t just happen. At the most senior levels, business takes place face-to-face. It’s about making true connections, sharing ideas, and connecting with the right people. The Premier Business Leadership Series (PBLS) offers just such an opportunity, a chance for business executives to build connections with

SASuser power! Does this phrase conjure up any images for you? I visualize SAS users across the globe, addressing messy data, combating fraud, and making use of business analytics to provide insight and add business value for organizations around the world. We, SASusers are powerful! With the Potential of One
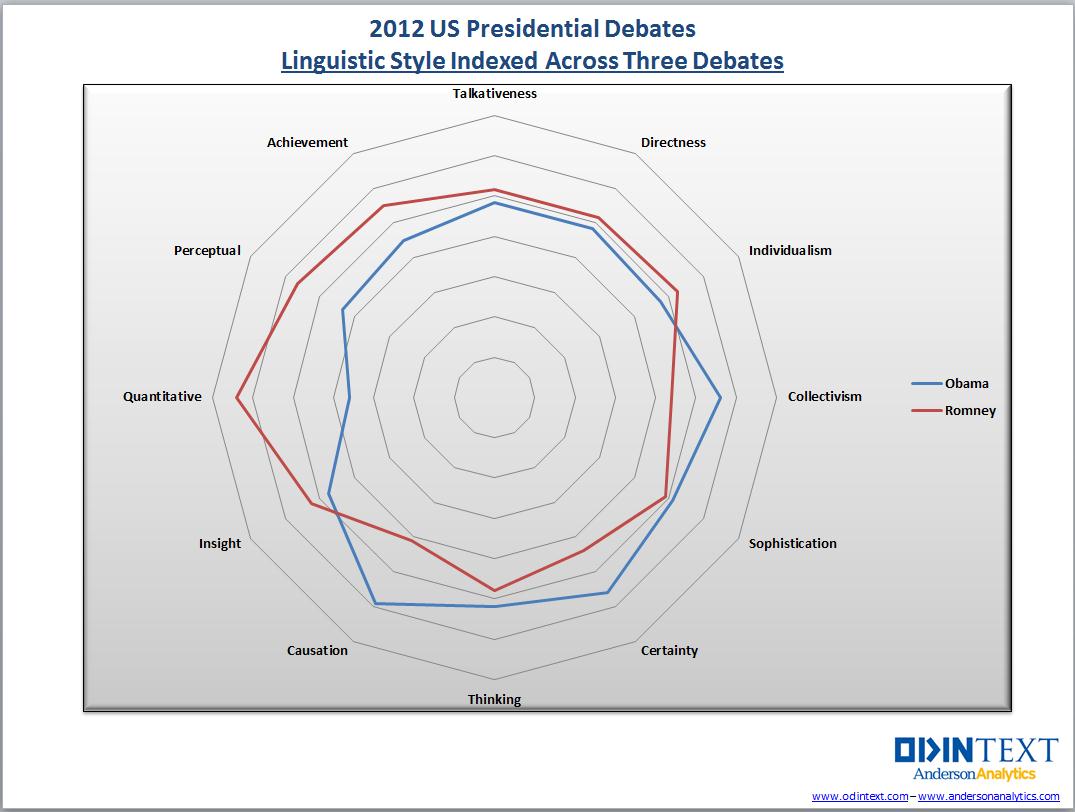
A common visualization is to compare characteristics of two groups. This article emphasizes two tips that will help make the comparison clear. First, consider graphing the differences between the groups. Second, in any plot that has a categorical axis, sort the categories by a meaningful quantity. This article is motivated
Once I was chairing a conference where the speaker was explaining the business model for the licensing of the Peanuts cartoon characters - Charlie Brown, Snoopy and the gang - and how all that works when it comes to the balloons for the Macy’s Thanksgiving Day Parade (in case you are wondering,

Im Controlling stehen heute enorme Datenmengen zur Verfügung. Diese liegen allerdings oft ungefiltert und z.T. in unstrukturierter Form vor. Erkenntnisse aus diesen komplexen Daten zu ziehen ist dabei eine der größten Herausforderungen. Vor allem dann, wenn Fragestellungen des Managements nicht mit den auf der Hand liegenden Daten beantwortbar sind. Methoden
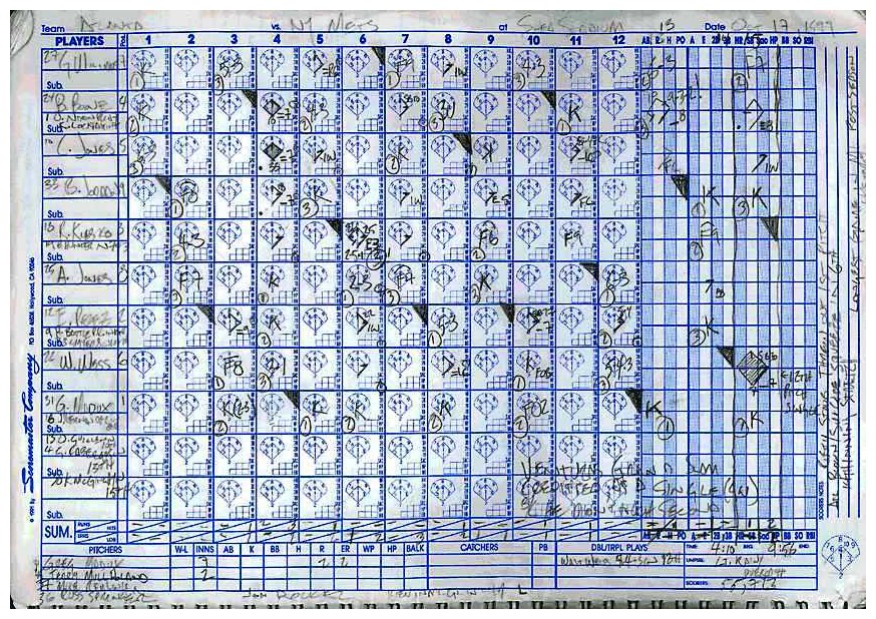
You’ve likely played an organized sport at some time in your life - How many different ways were there to keep score? How many different ways were there to determine the winner? Just one – right? It was goals, or runs, or points, or something, but never goals and/or assists,

Mercifully, we have reached the final installment of Q&A from the June 20 Foresight-SAS webinar, "Forecast Value Added: A Reality Check on Forecasting Practices." As a reminder, a recording of the webinar is available for on-demand review, and the Foresight article (upon which the webinar was based) is available for free

In the first post in this series, Seeing the Light: How SMBs are Using Data and Insights to Get Ahead, I shared the motivations that prompted three SMBs (BGF Industries, Oberweis Dairy and Twiddy & Company) to replace spreadsheets and intuition with a more sophisticated, analytics-driven approach. But what factors

First of all, congratulations to everyone who presented at SAS Global Forum 2013. Your hard work and contributions are what make it a success each year. Even though SAS Global Forum 2013 has come and gone, all of the papers and presentations are still available online. Out of this fantastic


