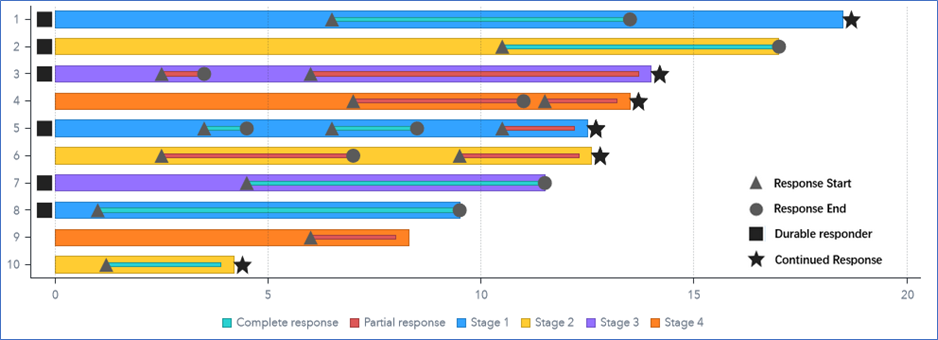
How to draw a swimmer plot in SAS Visual Analytics

SAS' Cindy Wang shows you how to create a swimmer plot using SAS Visual Analytics.
SAS' Cindy Wang shows you how to create a swimmer plot using SAS Visual Analytics.
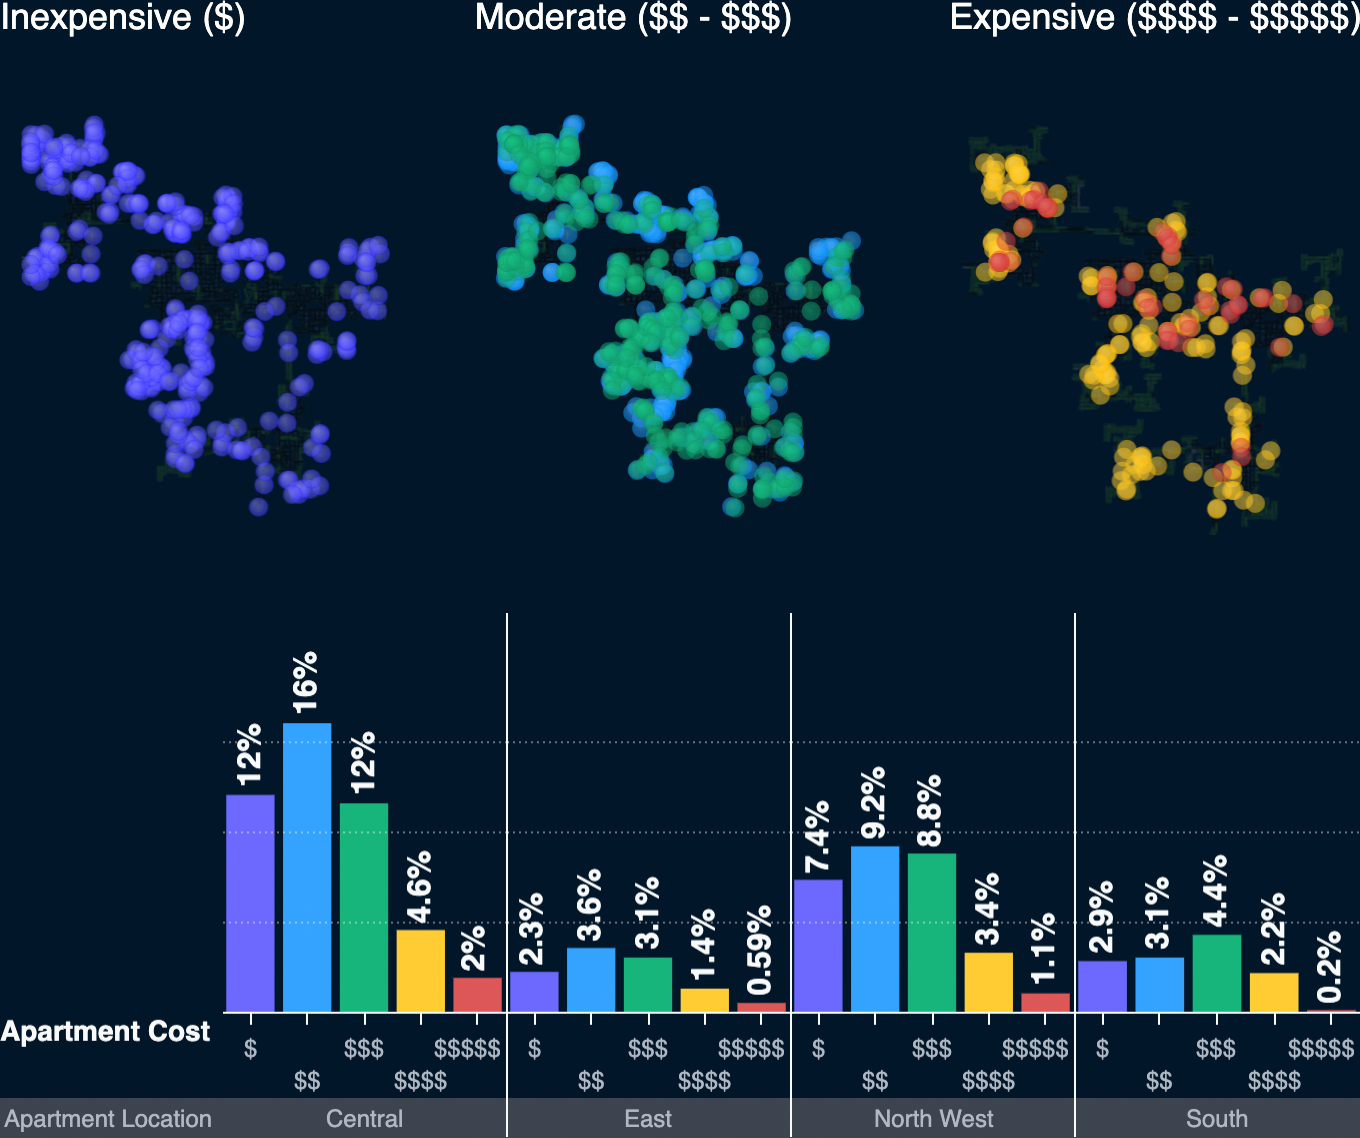
The IEEE Visual Analytics Science and Technology (VAST) Challenge provides a great opportunity to validate our software against real-world scenarios using complex data sets. Not only do we learn from these projects, but we also send feedback to our development teams to further improve product capabilities for customers.
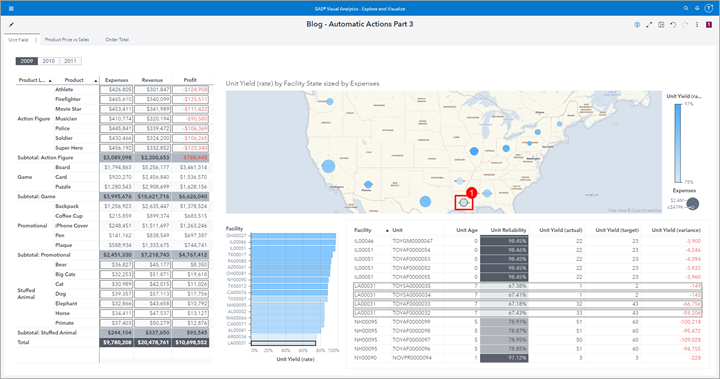
If you haven't explored data with Automatic Actions enabled yet, then read on to learn about some fast and easy ways to gain insights using One-way filters, Two-way filters or Linked Selection! Part 1 – Easy exploration for multiple data sources In this post, we focus on One-way filters. Here