Speed -vs- stability? ... let's graph it!

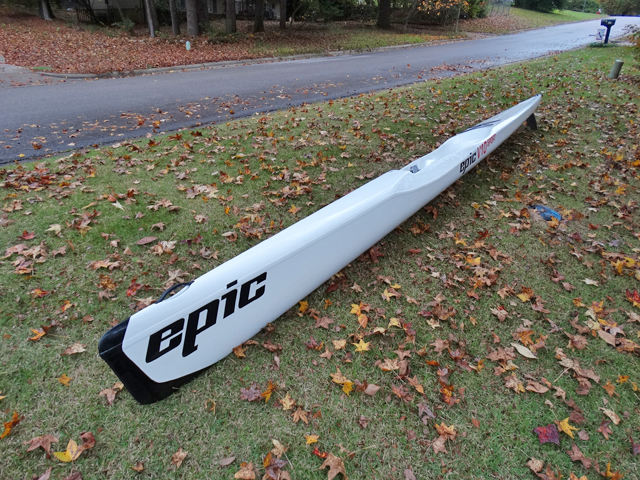
As you might have guessed from some of my previous blog posts, I'm an avid paddler. I like to paddle boats, and I like to try to go fast! And when I'm considering buying a new boat, it's only natural that I would analyze the data to make an informed