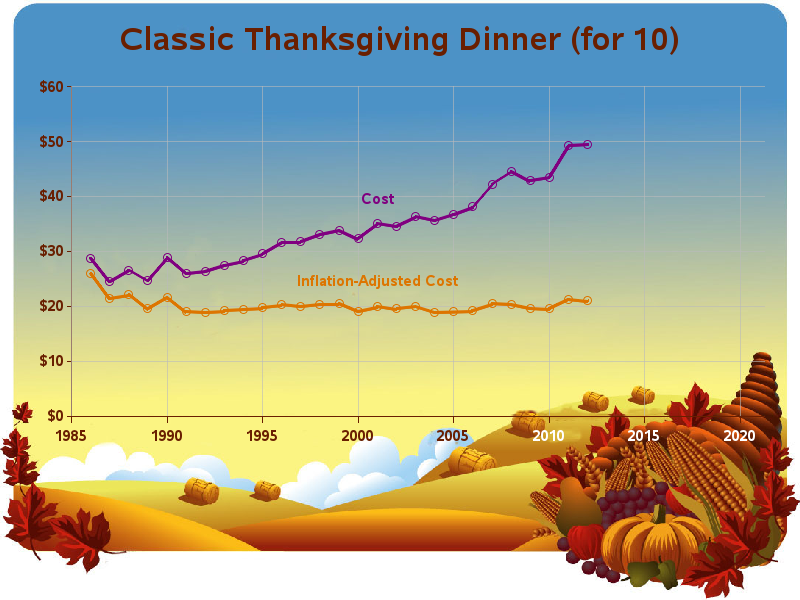
Have you heard the expression "Talk Turkey"? Well then, what better (tongue-in-cheek) thing to do around the Thanksgiving holiday, than talk some turkey using SAS Graphs! ;) I don't usually decorate my graphs with images and pictures (they typically make the graph more difficult to read), but when it comes
Tag: sas/graph
“Frankenstorm” is what the U.S. National Weather Service is calling the combination of Hurricane Sandy, an early winter storm heading east, and a blast of arctic air from the North. SAS headquarters is located in the middle of the U.S. east coast ... and we barely missed being the bulls-eye for this
If you're like me, you hate all those pop-ups you get suggesting (or sometimes forcing) that you install an upgrade such as Windows, Java, browsers, phone apps, etc, etc. And quite often they don't convince you why you'd want to upgrade (will life be better?) ... they just tell you to
I have to say that I've never heard of the Bubble option, so I looked it up on support.sas.com (my go-to place for searches on customer problems or to simply to learn something about SAS). The search led me to documentation for the statement options in SAS ODS Graphics. So, I assume the
By now, most of you probably already know how to add drill downs and hover text to your SAS graphs. But did you know you can add pop-up images and graphs? Here are a couple of examples ... In this first example, when you hover your mouse over each state, you
Do you use SAS for analytics and Microsoft Excel for graphs? Why not use SAS for your graphs too?!? Then you could completely automate the entire process in one SAS program, with no manual steps! A lot of people use Excel to create their graphs because "it's what they know." What if somebody
I am in countdown mode, in about a week I will be heading to SAS Global Forum 2012. As a SAS Instructor for over fourteen years, I have been to several conferences but never one in Orlando. I am excited for the busy forum that awaits. Sunday afternoon I will
contributed by SAS Publishing's Shelly Goodin For me, SAS Global Forum wouldn't be the same without getting a chance to catch up with SAS Press author Phil Holland. Besides being extremely knowledgeable about SAS (he's been using it since 1981), he is as enterprising and approachable as his popular book
Just flew back from Vegas, and boy, are my arms tired! (ba-dump) If you attended SAS Global Forum, you probably learned a lot of things you didn't know. But if you were a SAS employee, you also learned a lot of things you didn't know. One of the perks of
I believe I would have interviewed AnnMaria De Mars even if you hadn't sent me scads of e-mails and tweets suggesting her as a perfect candidate for the SAS Rock Stars series. I "met" AnnMaria when I started looking for SAS users on Twitter – nearly three years ago while
SAS Global Forum creates a big buzz in the SAS user community, so in order to find out what the fuss is about, I decided to chat with a couple of our instructors who would be going to Las Vegas. In addition to teaching pre-conference training, these two instructors will
A few months ago I wrote a blog entry titled "SAS/GRAPH "SG" Procedures--Not Just for Statisticians!" It was so well received that I was invited to open for Celine Dion at Caesar's Palace in Las Vegas! Well, not really, but I was invited (along with co-blogger Cynthia Zender) to give
If you are a SAS/GRAPH user, you may have heard about the new Statistical Graphics ("SG") procedures that are new in SAS 9.2. These procedures are designed to make it easier to produce common statistical charts and plots. You may have assumed that the procedures are only for folks who