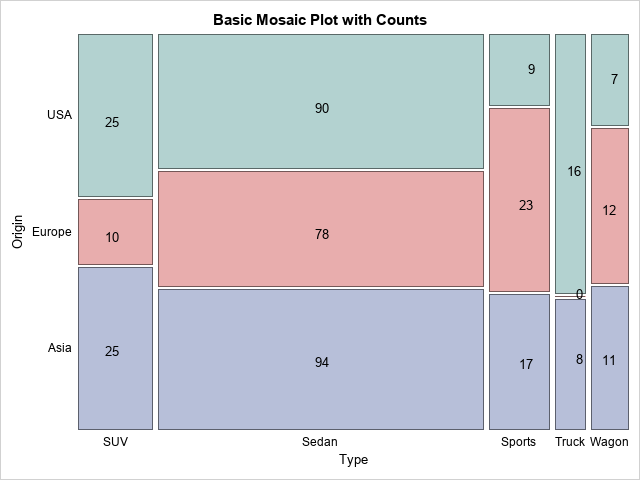
Tag: GTL

Data Visualization | Programming Tips
Warren F. Kuhfeld 0
Advanced ODS Graphics: A deeper dive into documents, dynamics, and data objects

You can modify all of the components of the graphs that analytical procedures produce: the data object, graph template, and the dynamic variables. This post takes a closer look at dynamic variables (which you can see by using PROC DOCUMENT) and data objects and explores graphs that are constructed from more than one data object.

Data Visualization | Programming Tips
Warren F. Kuhfeld 0
Advanced ODS Graphics: Examining and processing templates

This post shows a variety of techniques including how to use PROC TEMPLATE and the SOURCE statement, PROC SGPLOT with multiple Y-axis tables, create comparable axes in two side-by-side graphs, create a broken axis, write and use a table template that wraps text, and find and display examples of certain statements in graph templates and fonts in style templates.

Data Visualization
Sanjay Matange 0
Polar Graph

There are many situations where it is beneficial to display the data using a polar graph.  Often your data may contain directional information.  Or, the data may be cyclic in nature, with information over time by weeks, or years.  The simple solution is to display the directional or time data

Rick Wicklin 0
Create a surface plot in SAS

This article shows how to visualize a surface in SAS. You can use the SURFACEPLOTPARM statement in the Graph Template Language (GTL) to create a surface plot. But don't worry, you don't need to know anything about GTL: just copy the code in this article and replace the names of

1 2 3 4