Recently, I was given an amazing opportunity to work on a project in biomedical image analytics in collaboration with a large university medical center. The goal of the project was to develop a computer vision system that identifies tumors in CT scans of livers.
I have always loved applying technology to meaningful causes, especially in the medical imaging space. It’s mind-blowing and inspiring to me that the software I build could play even a small part in saving someone’s life.
I worked on this project in the Artificial Intelligence and Machine Learning Division of SAS R&D. Previously, I built a skin cancer assessment tool using statistical modeling and image processing. I’ve also developed an automated add-in builder for JMP Scripting Language and R. My knowledge from these projects carried through to this project where I built an end-to-end, automated data pipeline for liver tumor segmentation in CT scans with deep learning and computer vision.
I’ve documented the entire project in a series of blog posts that will publish over the next few weeks. First, I’ll tell you about my research for the project, and then you’ll learn how I applied that research to the final project.
Getting started with AI
I spent the first few weeks of this project getting familiar with SAS® Viya®, the constraints and the goals of the project, the capabilities of SAS Cloud Analytics Services (CAS), the current literature in medical image segmentation, and different convolutional neural network (CNN) architectures and their strengths. I also spent time developing a plan of attack for the project, running various scripts and toy neural networks, and testing those on my skin cancer data from my previous project. Finally, I installed the necessary python packages and started testing their capabilities too.
I became instantly interested in watching lectures on the internal workings of CNNs and loved delving into the literature on medical image segmentation. I also learned a lot by observing how neural networks assessed the skin cancer image data so differently from how I had handled it in the skin cancer project using statistical modeling. Rather than implementing programs for extracting features myself, I handed the reins over to the network and fed it the best data and parameters I could to let it do its work.
Right off the bat, I began to understand the AI hype and knew I was working with some powerful tools.
During this process, my mentor was indispensable. He showed me the ropes, from the nitty-gritty details to the overview of current CAS capabilities and the most recent literature in the image segmentation space. From sending me sample scripts for starting a server to pointing me to the necessary online resources for syntax and available action sets, he helped me through navigating the learning curve that comes with complex software and database systems.
Before we get any further, it’s a good time to introduce the entire data pipeline that I ended up implementing on a high level. Below, you’ll find a flow diagram of the pipeline I created for taking in a raw input image (straight out of the CT scanner) and creating a 3D black-and-white segmentation mask that identifies the location of lesions in that scan.
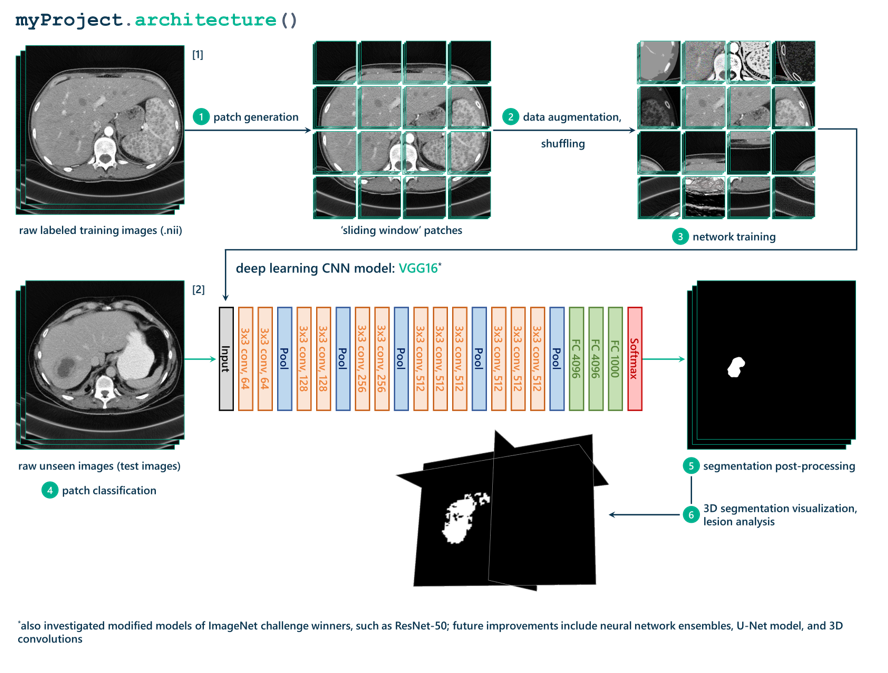
If you’re excited to learn more about the details in that diagram, check back soon to learn how we applied what I learned and redefined the plan for the project.


2 Comments
Pingback: Using deep learning for tumor segmentation in medical images - The SAS Data Science Blog
Very good knowledge and discovery.