Open data is critical to research, particularly at universities. The many university students that attend SAS Global Forum bring an energy and vitality to the conference that is unmistakable. They’re everywhere…in sessions, social activities, out on the town and, of course, the academic events. This year, 150 of them graced the stage during opening session. They were all current students of the SAS Global Forum chair, Oklahoma State University’s Dr. Goutam Chakraborty. (We love us some Dr. C.)
But perhaps nowhere do students get to show their analytics chops more than in the poster presentations. This year, there were several that analyzed open data to help government agencies keep citizens safe, and even inform immigration policy.
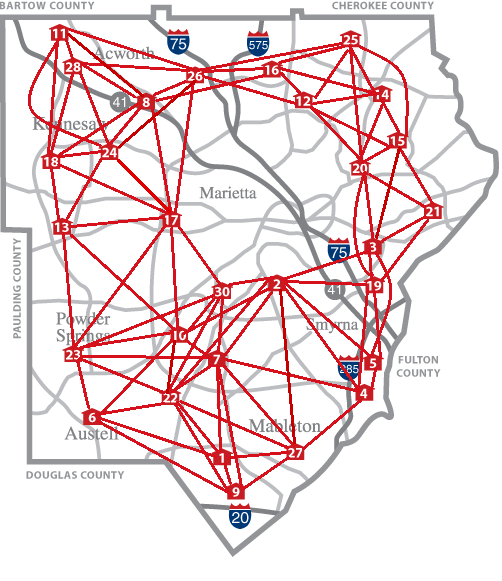
Reducing fire department response time with Google Maps, SAS and Python
The Cobb County (GA) Fire Department’s (CCFD) 8-minute emergency response time is twice the National Fire Protection Association’s 4-minute standard. A project by Bogdan Gadidov, Yiyun Zhou and Lili Zhang of Kennesaw State University aims to reduce CCFD’s response time by analyzing the travel times of various emergency vehicles.
Currently, there are 29 fire stations and 272 fire zones within Cobb County, with each fire station responsible for a pre-defined set of fire zones. Bogdan, Yiyun and Lili investigated whether fire zones and stations can be realigned to reduce travel times by analyzing historical response time data from September 2011 to August 2016. That data, from approximately 300,000 incidents, included which fire station responded to each incident, as well as the related travel time. The researchers used Google Maps to check the response times from neighboring fire stations to determine whether a different fire station could have responded more quickly to the same incident. The disagreements between the historically used and Google-recommended fire stations revealed opportunities to reassign zones to different stations to reduce future traveling times. Python was used to connect to the Google Maps Distance Matrix API, and SAS is used for resulting analyses.
The analyses revealed opportunities for improvement. The researchers recommended to CCFD that CCFD reassign 12 of the 272 fire zones in order to save, on average, 45 seconds per trip in those 12 zones. CCFD will implement changes to several of the zones and monitor traveling times over the next 6 months to one year.
Moving forward, the researchers will analyze data from opioid or drug-related emergency calls. CCFD is interested in exploring if there are areas within Cobb County with higher rates of drug-related emergencies, and analyzing the demographics of these areas.
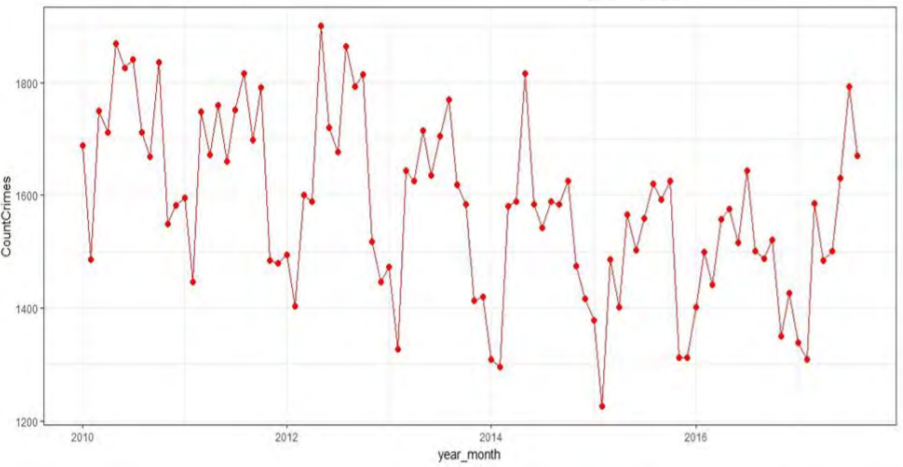
Predicting crime in Los Angeles with SAS, open source and open data
Zaid Shaikh from Oklahoma State analyzed more than 7.5 years of Los Angeles crime data to predict the potential number of crime incidents for a city, and provide insights for first-responders and law enforcement. The data set, which was made publicly available by the Los Angeles Police Department, consists of more than 1.4 million observations and 26 variables. Primary exploratory data analysis provided basic insights such as the district where crime is most prevalent, the most commonly used weapon (strong arm - hand fist) and the most common crime occurrence time (noon). Trend analysis revealed that the crime rate had significantly increased after 2014 and that Battery - Simple Assault was the most common crime.
Zaid used SAS Enterprise Guide and R for data cleaning, exploration, and data modeling. His continues to experiment with a variety of predictive and forecasting models to predict crimes.
Analyzing State Department data to find most promising H-1B visa candidates
Many employers, particularly those in tech, compete for a small pool of foreign talent in the form of H-1B visa holders. These temporary work permits go to people with specialized talents in high-demand professions such as software engineering, operations research, biotechnology, etc. The H-1B application and administrative process for companies can be laborious and expensive. Thus, it’s critical that the H-1B visa holders that are selected become valuable members of their new teams.
Shibbir Khan of Clark University conducted research to help US employers and legislators predict which H-1B employees are most likely to earn permanent visa status. With such high demand and intense competition for talent, it’s vital to ensure that all the time and money is spent on the workers most likely to succeed. Kaggle and Github contain data from the Office of Foreign Labor Certification’s iCERT Visa Portal System. Using that data, Shibbir built several predictive models to signal which H-1B visa recipients are likely to sustain employment and eventually succeed. His analysis indicated that certain factors play a more important role in a person gaining permanent status, such as a well-known employer, prevailing wage and certain types of occupations.
Reducing theft in the Windy City
In 2016, Chicago reported more thefts than any other crime. Shikha Prasad, a graduate student at Oklahoma State, analyzed public data from Kaggle to uncover patterns related to the rash of Chicago thefts. Shikha sought to answer questions like, What are the specific locations where most thefts are committed? What could be the possible reasons for the frequency of thefts being higher in those locations than other crimes? The Kaggle data set contained more than a million observations from 2012 through 2017.
Shikha built several predictive models such as logistic regression, decision tree, neural network and ensemble. For creating the binary target, FBI codes 06 (theft) and 07 (motor vehicle theft) were assigned a value of 1 while all other crimes were assigned a value of 0. Shikha compared the performance of the models, with ensemble emerging as the best. She also prepared time series data by aggregating the total number of thefts for each month, which was used to forecast the number of thefts likely to take place in the next 12 months.
These innovative students are not just showing off their predictive modeling and analytics prowess. They are bringing a variety of tools to bear on open data, and uncovering new insights into issues that can change, or save, lives.
These are just a few of the brilliant student presentations that bring such excitement to SAS Global Forum. If you are a professor or student interested in sharing research next year in Dallas, keep an eye out for the launch of the SAS Global Forum 2019 website.
To take a deeper dive into the many sessions and presentations from this year’s event, check out the easily searchable SAS Global Forum 2018 sessions page.