Welcome to Part 2 of the value-added Myth Busters blog series…have you heard this one before?
Educators serving high-achieving students are often concerned that their students’ entering achievement level makes it more difficult for them to show growth. “How can my students show growth if they are already earning high A’s on all of their assessments?”
Myth Busted:
With EVAAS, educators are neither advantaged nor disadvantaged by the type of students that they serve. The modeling reflects the philosophy that all students deserve to make appropriate academic progress each year. Students are compared against themselves and the amount of progress they have previously made across all tested grades and subjects.
Additionally, standardized assessment scales typically have enough “stretch” to assess measurable differences between students who score close to the top score. That is one of the base criteria SAS looks for before running any value-added analyses. If a test does not have enough “stretch,” SAS would not provide value-added estimates on the assessment. As such, EVAAS provides reliable and valid measures of growth for students, regardless of their achievement level.
As with Myth #1, actual data may be the most readily apparent evidence. The graph in Figure 1 plots the average entering achievement for each school in Tennessee against its growth index (the value-added estimate divided by its standard error) for the state math assessment in grades 4-8 in 2012. These data come from Tennessee’s public website.
FIGURE 1: GROWTH INDEX V. AVERAGE ACHIEVEMENT BY SCHOOL
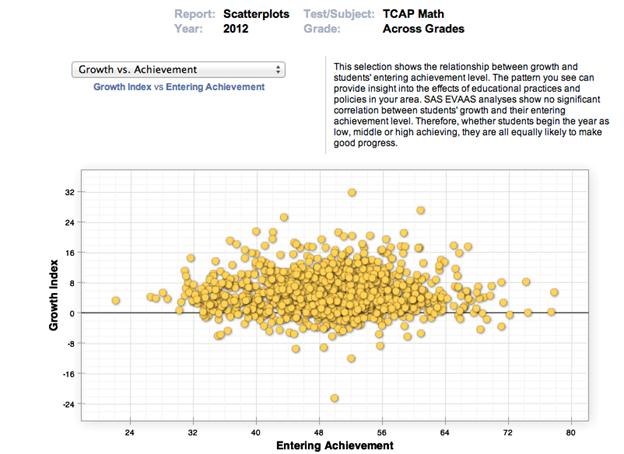
Regardless of the school’s achievement level, there is essentially no correlation to the growth index. In other words, the dots representing each school do not trend up or down as achievement increases; the cluster of dots is fairly even across the achievement spectrum. Schools serving both very high-achieving (on right), or low-achieving (on left), populations of students are demonstrating great gains with their students. In fact, many of them are above the zero line, meaning they made more than the expected amount of growth with their students in 2012.

1 Comment
Pingback: Top rated value-added school: Extreme test prep or well-rounded experience? A student’s perspective - State and Local Connection