In the past five years, value-added models have been increasingly adopted by states to support various teaching effectiveness policies. As educators make the paradigm shift from looking at only achievement data to incorporating growth data, many misconceptions have developed. Compounding this issue is the fact that not all value-added and growth models are alike. What may be true for a simplistic model, may be a myth for a more statistically robust methodology. Therefore, I'm launching a series of blog posts that will serve as “myth busters” for common value-added misconceptions, based on SAS’ 20+ years of experience working with education value-added analyses.
Tell me what additional myths you are hearing and I’ll try to address them in future posts!
Myth #1:
Student growth is correlated with certain demographic variables, so value-added models should control for demographics.
It is widely known that students with certain socioeconomic or demographic (SES/DEM) characteristics tend to score lower, on average, than students with other SES/DEM characteristics. There is concern that educators serving those students could be systematically disadvantaged in the modeling.
Myth busted:
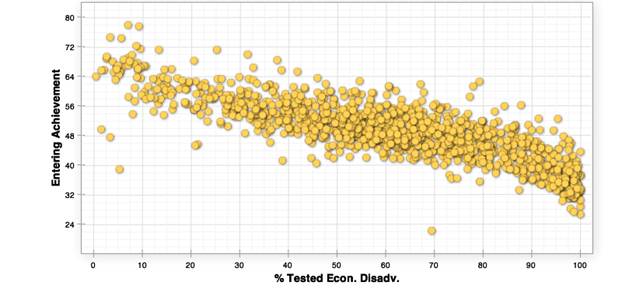
It is understandable that this myth has persisted because most educators know the impacts that poverty can have on student achievement, as seen in Figure 1, which contains publicly available data from Tennessee’s TVAAS website.
FIGURE 1: ENTERING ACHIEVEMENT V. PERCENT TESTED ECONOMICALLY DISADVANTAGED BY SCHOOL
![]()
To combat this issue, some value-added models take the “kitchen sink” approach and try to control for every student characteristic possible in order to level the playing field. However, these adjustments are not statistically necessary for the most sophisticated value-added models, such as those used by SAS EVAAS. Because the models used by SAS incorporate more student assessment data across all grades and subjects, each student serves as his or her own control. While a picture is worth a thousand words, actual data may be the most readily apparent evidence.
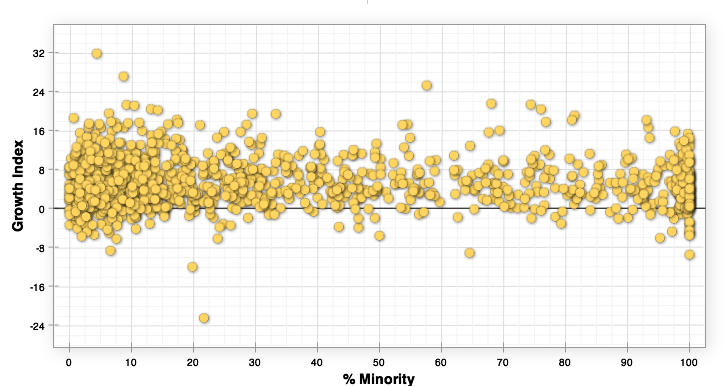
The graph in Figure 2 plots the percentage of tested students who are considered economically disadvantaged at each school in the State of Tennessee against the school’s growth index (the value-added estimate divided by its standard error) for the state math assessment in grades four through eight. Figure 3 provides similar information for the percentage of minority students. Regardless of the school’s student characteristics, there is essentially no correlation to the growth index. In other words, the dots representing each school do not trend up or down as the percentage increases; the cluster of dots is fairly even across the spectrum.
FIGURE 2: GROWTH INDEX V. PERCENT TESTED ECONOMICALLY DISADVANTAGED BY SCHOOL
![]()
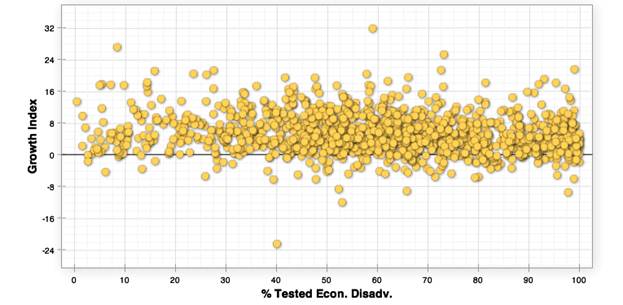 FIGURE 3: GROWTH INDEX V. PERCENT TESTED MINORITY BY SCHOOL
![]()
Adjustments for student characteristics may be important with any model where you do not see such a level playing field, or from a communications standpoint. However, with EVAAS’ value-added models, no teacher is advantaged or disadvantaged by the types of students they serve because all students (rich, poor, Caucasian, or minority) can demonstrate growth.

1 Comment
Pingback: Busting myths of education value-added analysis, Part 2: It is harder to show growth with high-achieving students - State and Local Connection