![]() If you use SAS Visual Analytics and don’t have the SAS Visual Analytics app, you're missing out on a ton of convenience and interaction you could be having while on-the-go. And even if you don’t have access to SAS Visual Analytics today, you can still download and try the mobile app with some cool sample reports.
If you use SAS Visual Analytics and don’t have the SAS Visual Analytics app, you're missing out on a ton of convenience and interaction you could be having while on-the-go. And even if you don’t have access to SAS Visual Analytics today, you can still download and try the mobile app with some cool sample reports.
Ready to take a quick dive and look at the app?
How to get the app
Download and install the free app to your Apple, Android or Windows device from the app store:
Apple iTunes Store
Google Play
Microsoft Store
When you open the app, you are greeted with an introductory launch screen:
In the introductory launch screen that displays when you first open the iOS or Android app, go to the third screen and tap on Learn how to use the Tray.
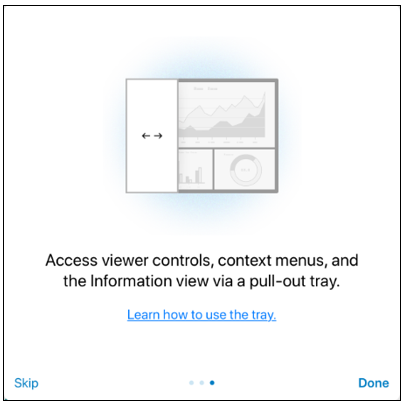
You are taken to the SAS Help Center. Watch the short slide show at the help center to understand the special Tray feature in the iOS or Android app or to find out what’s new in the app.
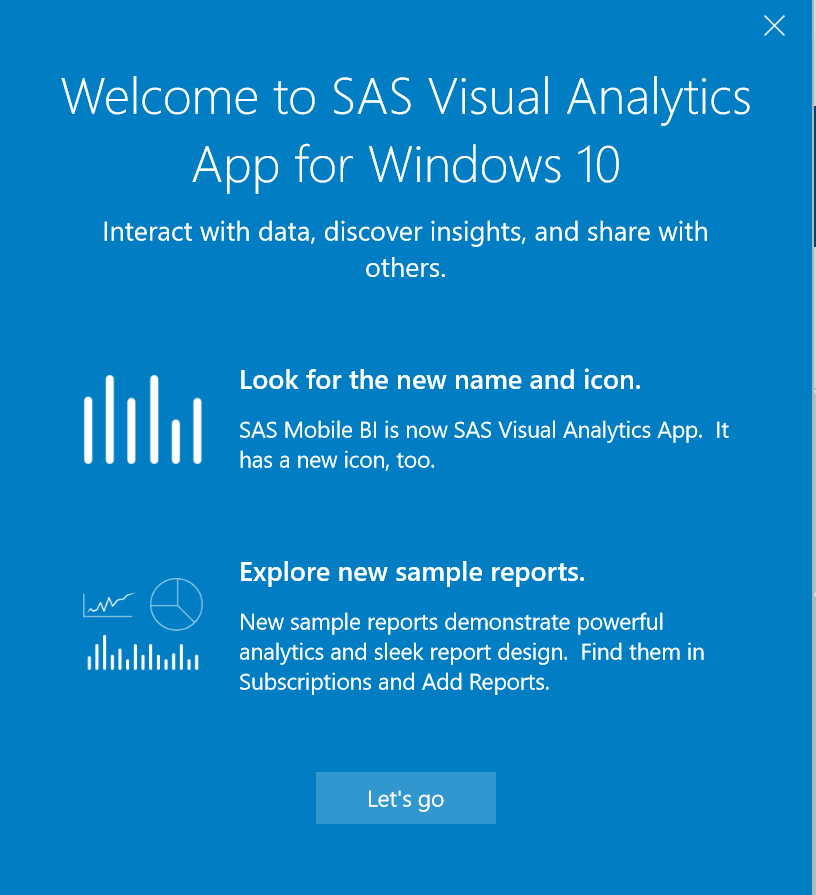
Using the Windows-based app? Here’s what you see:
Sample reports on the SAS Demo Server
In the app, sample charts and reports are instantly made available to you in the Subscriptions view via a connection to the SAS Demo Server. This server hosts a nice variety of reports that you can view on your phone or tablet. Interact with a wide spectrum of sample SAS Visual Analytics reports for different industries.
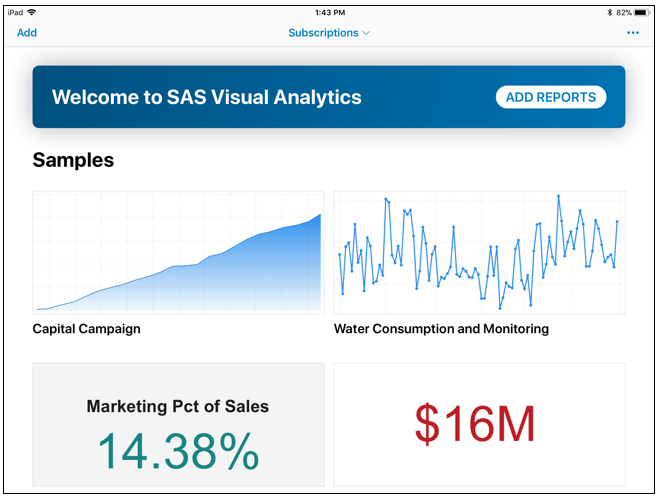
Tap on Add to view the different folders that contain additional sample reports for you to browse, subscribe, and view.
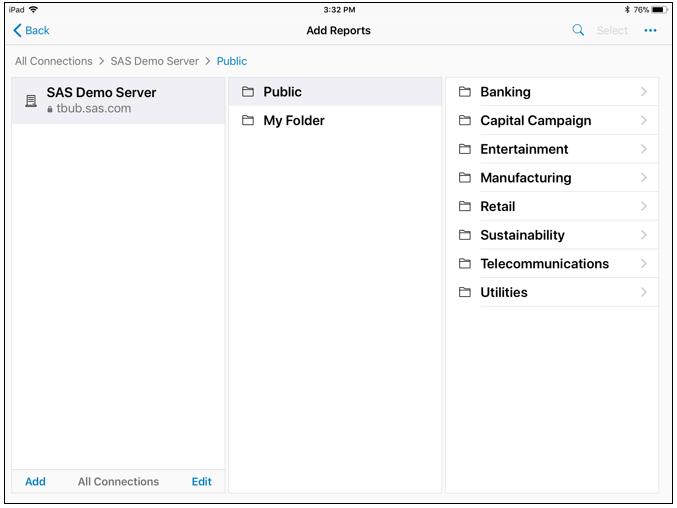
When you select and subscribe to the additional reports that are available on the SAS Demo Server, these reports are downloaded to the Subscriptions view in the mobile app. Just tap on the tile for any report in the Subscriptions view to open it and view the charts, graphs, and their associated data.
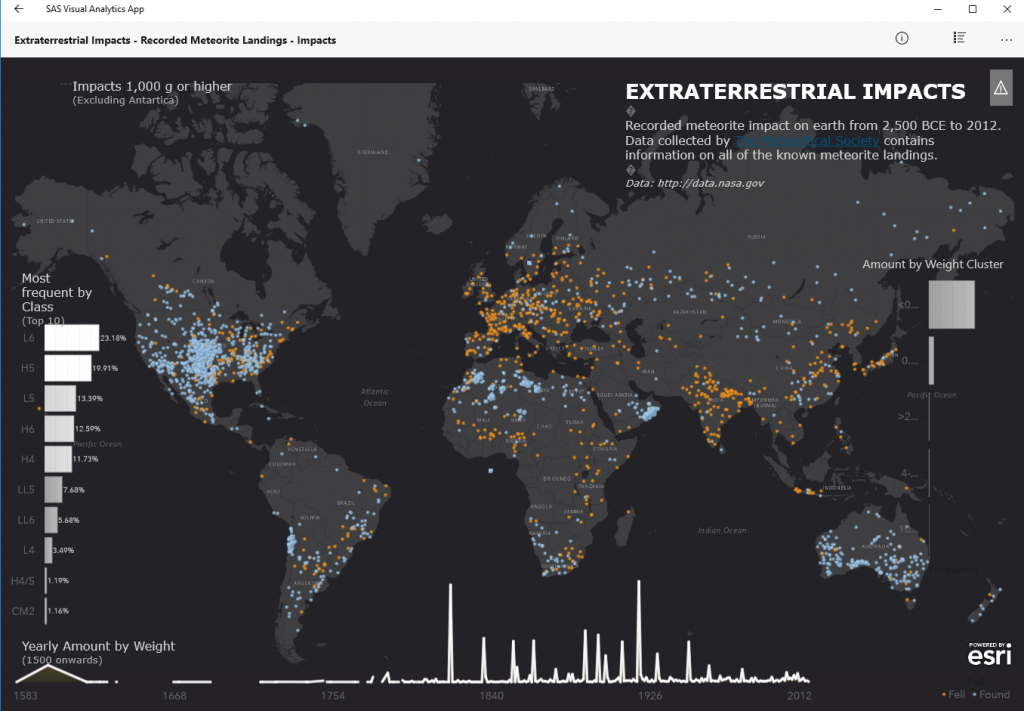
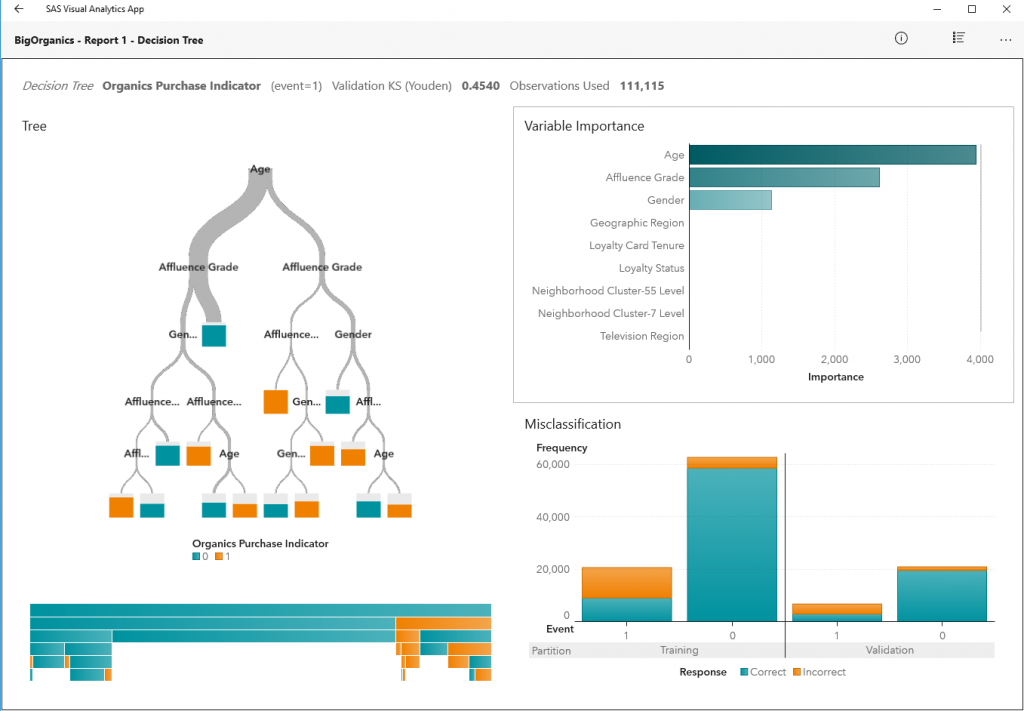
Here are a couple of reports as viewed in the Windows 10 app:
Already have SAS Visual Analytics in your organization?
If you view SAS Visual Analytics reports on your laptop or a desktop computer, this app extends your ability to view those same reports on your phone or tablet. If your organization has deployed SAS Visual Analytics, but is not taking advantage of extending report viewing ability to mobile devices, I urge you to consider it.
The app supports SAS Visual Analytics 8.3, 8.2, 7.4, and 7.3. Almost every type of interaction that you have with a SAS Visual Analytics report on your desktop can be done with reports viewed in the app on your phone or tablet!
If you have SAS Visual Analytics deployed in your organization, reach out to the SAS Visual Analytics administrator in your organization and ask them to enable support for mobile devices so that you can start viewing your reports in the app.
To give you a little more guidance, here are some FAQs about the app.
If we have reports in our organization that were created with SAS Visual Analytics, can we view those reports in this app?
Yes. The same reports that you view in your web browser on a desktop can be viewed in the mobile app.
How do I view our organization’s reports in the app?
Access from your mobile device to SAS Visual Analytics reports on your company’s server is granted by your SAS Administrator. Live data access requires either a Wi-Fi or cellular connection, and your company may require VPN access or other company-specific security measures.
Contact your SAS Visual Analytics Administrator to request access from your mobile device to the server hosting your SAS Visual Analytics reports. Your administrator ensures that your mobile device is registered as a valid device in the SAS Environment Manager where mobile device access to your organization’s server is managed.
How do I add a server connection?
When your mobile device is registered for access to the SAS Visual Analytics server, simply create a server connection within the app to your company server and browse for reports.
Here’s a nice slide show with the steps you follow to create a server connection to the SAS Visual Analytics server by entering the complete server name, port number, your username, and password:
Now you should have a connection established to your company’s server, and the folders where your reports reside.
What type of features are available in reports that are viewed from the app?
Almost all of the features that are available in the desktop-based reports are supported in the app. Drilling, filtering, brushing, display rules, linking, info windows are just some of the key features available to you when you interact with reports via this app.