 The SGPLOT procedure (as well as other ODS Graphics procedures) does a great job of creating nice- looking output with very little coding. However, there are times when you want to make adjustments to the output's appearance. For those occasions, we have an ATTRS for that!
The statements in PROC SGPLOT include many options that enable you to change the attributes for parts of the plot. Each of these options ends in ATTRS, which makes them easy to find in code.
Before you can change the attributes, you need to know which part of the plot you want to change. For example, do you want to change the color of the line, the marker symbol, the size of the label font, and so on? Once you know the part of the graph that you want to change, you can search the PROC SGPLOT documentation for an ATTRS option.
In the following PROC SGPLOT code, we have added some ATTRS options to demonstrate the types of changes you can make to a graph.
proc sgplot data=sashelp.class; vbar age / stat=freq datalabel datalabelattrs=(size=12pt color=blue) fillattrs=(color=cx66A5A0) transparency=0.3 dataskin=matte name='bar' legendlabel='Frequency of age'; vline age / stat=percent markers markerattrs=(symbol=circlefilled color= cx01665E size=12px) lineattrs=(color=cxD05B5B thickness=3px) curvelabel='Percent Line' curvelabelattrs=(size=11pt style=italic) curvelabelloc=inside curvelabelpos=min name='vline' legendlabel='Percent of age' y2axis; refline 4 / axis=y lineattrs=(pattern=2 thickness=2px) label='Refline' labelattrs=(size=12pt) labelpos=min labelloc=inside; xaxis valueattrs=(size=10pt color=navy); yaxis labelattrs=(size=12pt weight=bold) offsetmin=0; keylegend 'bar' 'vline' / title='My legend' titleattrs=(color=blue size=14pt) valueattrs=(size=12pt) noborder; run; |
The figure below shows the graph that is produced by this PROC SGPLOT code. In the figure, some labels are added to help you identify the part of the graph that is modified using an ATTRS option. Note that this graph depicts only some of the ATTRS options that are available. For other ATTRS options, see the SAS® 9.4 ODS Graphics: Procedures Guide, Sixth Edition for the specific plot statement that you want to use.

In this figure:
- The LABELATTRS= option enables you to change the color, font family, font weight, font style, and size for the axis or reference line labels.
- The LINEATTRS= option enables you to change the color, pattern, and thickness for the plot line.
- The CURVELABELATTRS= option enables you to change the color, font family, font weight, font style, and size for the text that is added by the CURVELABEL= option.
- The DATALABELATTRS= option enables you to change the color, font family, font weight, font style, and size for the text that is added by the DATALABEL= option.
- The MARKERATTRS= option enables you to change the color, size, and symbol for the plot markers.
- The FILLATTRS= option enables you to change the color and transparency of the bar colors.
- The VALUEATTRS= option enables you to change the color, font family, font weight, font style, and size for the axis tick-value labels or legend value labels.
- The TITLEATTRS= option enables you to change the color, font family, font weight, font style, and size for the legend title.
For more information about attribute options, see the Commonly Used Attribute Options section of the SAS® 9.4 ODS Graphics: Procedures Guide, Sixth Edition.
The ATTRS options affect all of the output that is produced by that statement. This means that if you include the GROUP= option, all of the groups use the attributes that are specified in the ATTRS options. This behavior is great if you want all of the lines to use the same line pattern, but it can be a problem if you want to specify colors for each of your lines.
Beginning with SAS 9.4, the STYLEATTRS (notice the ATTRS ending) statement is part of the SPLOT (and SGPANEL) procedure to enable you to define attributes for grouped data.
For example, the following code uses the DATACONTRASTCOLORS= option to specify the colors for the marker symbols and the DATASYMBOLS= option to specify the symbols that are to be used.
ods graphics / attrpriority=none; proc sgplot data=sashelp.class; styleattrs datacontrastcolors=(pink blue) datasymbols=(circlefilled squarefilled); scatter x=age y=height / group=sex markerattrs=(size=10px); xaxis valueattrs=(size=12pt) labelattrs=(size=14pt); yaxis valueattrs=(size=12pt) labelattrs=(size=14pt); keylegend / valueattrs=(size=12pt) titleattrs=(size=14pt); run; |
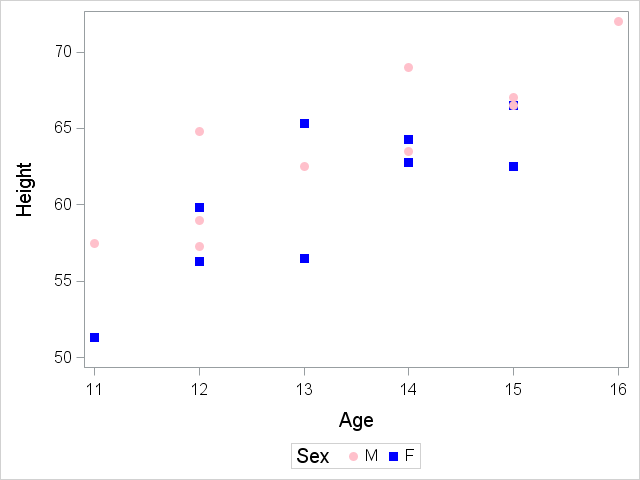
You also might need to add the ATTRPRIORITY=NONE option in your ODS GRAPHICS statement to cycle the colors and symbols as expected. For more information about how the attributes are applied to the grouped values, see the How the Attributes Are Cycled section of the SAS® 9.4 ODS Graphics: Procedures Guide, Sixth Edition.
The attributes that are listed in the STYLEATTRS statement are associated with the group values in the order in which they appear in the data set. This behavior can cause the same value to be associated with a different color when you use the same code with another set of data.
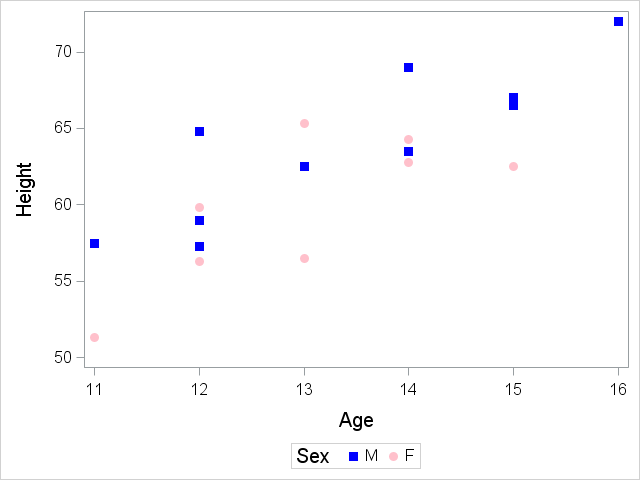
To associate an attribute with a specific data value, you can define an attribute map. The attribute map is a data set, referenced in the DATTRMAP= option in the PROC SGPLOT statement, which includes variables that indicate to the SGPLOT procedure how to assign attributes to the group variable values.
Within the attribute map, the ID variable identifies the variables that are specific to a particular set of group values. The VALUE variable identifies the data value for the group variable that you want to associate with attributes. Note that if the variable for the GROUP= option has an associated format, the VALUE variable in the attribute map needs to contain the formatted value.
The other variables in the attribute map data set define attributes such as color, symbol, line thickness, and so on.
For example, the following code defines an attribute map to assign the color pink and the filled-circle symbol to group value F and the color blue and the filled-square symbol to the group value M:
data myattrmap; id='scattersymbols'; length markersymbol $12; input value $ markercolor $ markersymbol $; datalines; F pink circlefilled M blue squarefilled ; proc sgplot data=sashelp.class dattrmap=myattrmap; scatter x=age y=height / group=sex markerattrs=(size=10px) attrid=scattersymbols; xaxis valueattrs=(size=12pt) labelattrs=(size=14pt); yaxis valueattrs=(size=12pt) labelattrs=(size=14pt); keylegend / valueattrs=(size=12pt) titleattrs=(size=14pt); run; |
Your attribute-map data set can contain multiple attribute maps, using a different value for the ID variable to distinguish each of the attribute maps. For more information about attribute maps, see the Using Attribute Maps to Control Visual Attributes section of the SAS® 9.4 ODS Graphics: Procedures Guide, Sixth Edition.
As you can see, there are many ways to assign attributes to plot elements. So, the next time you want to make a change to the visual appearance of your graph, remember that we have an ATTRS for that!
If you would like to see how to make attribute changes using a style template, read Dan Heath’s 2017 SAS Global Forum paper, Diving Deep into SAS® ODS Graphics Styles.

17 Comments
Hi Marcia, do you know of a way to change the styling of one of the values on an axis?
Like in your example above if say 14 was a very crucial age I'd like 14 to be in red but not the other ages along the xaxis.
The only thing I can think of is overlaying a graph with only one value (that is red) on top of another graph (with normal colored values) Haven't tried it but maybe there is an easier way?
Hi Andreas,
There's not an option to allow you to change the attributes for individual tick values.
One way to create the look of axis tick values with different attributes is to use SG annotation to place text at the X axis tick marks. Annotating the values provides control over each label.
Below is a sample that shows how to do this.
If you have problems getting this to work, you can open a track with SAS Technical Support and we will be happy to provide additional assistance.
data anno; /* define the X1 drawing space as data values */ x1space='datavalue'; /* define the Y1 drawing space as the percent of the wall area */ y1space='wallpercent'; /* define the annotate function as TEXT */ function='text'; /* set the length for the textcolor variable */ length textcolor $8; /* set the size of the text font to match the size specified in the YAXIS statement */ textsize=12; /* define the vertical location under the X axis. This value might need to be adjusted */ y1=-5; /* define the horizontal location as one of the known tick values */ do x1=11 to 16; /* define the label to be placed on the graph */ label=put(x1,3.); /* specify the text color */ if x1=14 then textcolor='red'; else textcolor='black'; output; end; run; /* include the annotate data set using the SGANNO= option */ proc sgplot data=sashelp.class sganno=anno; styleattrs datacontrastcolors=(pink blue) datasymbols=(circlefilled squarefilled); scatter x=age y=height / group=sex markerattrs=(size=10px); /* Modify the X axis to specify the axis range. Display the values as blank to create space for the annotated values */ xaxis values=(11 to 16 by 1) valuesdisplay=(' ') labelattrs=(size=14pt); yaxis valueattrs=(size=12pt) labelattrs=(size=14pt); keylegend / valueattrs=(size=12pt) titleattrs=(size=14pt); run;Thank you so much Marcia for the great description of all labels and attributes.
I have dates on my X-axis and I am looking for a way to fill different color or any other ways to highlight only weekends (Saturday and Sunday). Please let me know a way to do the same.
Thank you so much Marcia for the great description of all labels and attributes.
I have dates on my X-axis and I am looking for a way to fill different color or any other ways to highlight only weekends (Saturday and Sunday). Please let me know a way to do the same.
Thank you!
Hey Marcia I need help with a code (sgplot vline) that includes more than 2 variables with different symbols each, the mean and stddev, and the asterisk for the significant difference, could you help me?! Thank you
Hi Marcia,
i have 2 questions. 1 - How to increase size of datasysmbols? i have used markerattrs=(size=20) but it did not increase after one point.
2 - how to add tick on log based y axis?
just a note, i have used Proc SGPLOT
Hi Mak,
1- How to increase size of datasysmbols? i have used markerattrs=(size=20) but it did not increase after one point.
Using the MARKERATTRS=(SIZE=) option is the correct way to specify the size of the marker symbols. Changing the value for the size should change the size of the symbol in the graph. For example, this will show two different size marker symbols.
proc sgplot data=sashelp.class noautolegend;
scatter x=age y=height / markerattrs=(size=20);
scatter x=age y=weight / markerattrs=(size=30);
run;
Can you send your code that shows the size not changing for your marker symbols?
2 - how to add tick on log based y axis?
I'm not sure exactly what you're asking in this question.
If you want to send email to support@sas.com we can open a track and get more information about what you want to add to your axis.
Thanks,
Marcia
Hi Marcia,
I'm Pulling my Hair out. The data for the variable lower prints just fine using d5.1 but the format doesn't seem to work for the datalabel in proc sgplot. Basically, I need to suppress all 0s unless there is only 1 zero in the decimal place - e.g. I need 11.0 but not 11.00. I can't use F5.1 because some values are .02 or .03. TIA Audrey
data eye.graph_parm;
informat lower d5.1;
format lower d5.1;
retain time_of_day upper lower pvalue;
set graph_final;by time_of_day trial;
if first.trial;*only need one row;
format upper 5.1;
rename trial = Trial;
label Trial = 'Trial';
Label pvalue = 'p-value';
Label upper = 'Upper';
Label lower = 'Lower';
if Trial = 5 then Trial = 4;
if Trial=4 and Time_of_Day = 3 then Lower = 0.03;
if Trial=4 and Time_of_Day = 4 then Lower = -0.02;
if Trial=4 and Time_of_Day = 1 then Lower = -0.5;
if Trial=4 and Time_of_Day = 2 then Lower = -0.5;
proc print;
run;
Title 'Predicted Mean IOP';
ods listing style=listing;
proc sgplot data=eye.graph_parm;
format lower d5.1;
vbarparm category= time_of_day response=Pred / group=Trial groupdisplay=cluster limitlower=Lower limitupper=Upper
limitattrs=(color=black) DATALABELPOS=TOP datalabel ;
yaxis max=14 min=.05 Label ='Predicted Mean IOP' values=(-1 0 to 14 by 2);;
xaxis label = ' ';
xaxistable pvalue / stat=mean location=inside position=top;
run;
Hi, Marcia,
My program:
proc sgplot data=DUNES;
vbox P / Group=Species category=Site;
inset "F =10.78 "
"Pr > F 0.0004"
labelattrs=(color=black size=15pt);
xaxis discreteorder=data;
xaxis discreteorder=data
labelattrs=(color=black size=15pt)
valueattrs=(color=black size=15pt)
;
yaxis discreteorder=data
labelattrs=(color=black size=15pt)
valueattrs=(color=black size=15pt);
keylegend /
valueattrs=(color=black size=15pt)
titleattrs=(color=black size=15pt)
;
run;
How can I change size of "F =10.78 " "Pr > F 0.0004"
Thank you
If you want to change the font size of the text in the INSET statement you can use the textattrs=(size=16).
Example:
proc sgplot data=sashelp.cars;
vbar Type;
inset "Type of Cars" / textattrs=(size=18pt color=Navy);
run;
https://go.documentation.sas.com/?docsetId=grstatproc&docsetTarget=p0hz27ehuzdd6pn0zaic6x52pkav.htm&docsetVersion=9.4&locale=en#p0m2l14t4c3cdun1ciwyfcekvqjr
Hi Marcia,
Is there a way to change the attribute of one line of a group specified in a category statement?
For example, the "year" category in the below. I would like the current year (2020) to stand out from the other 5 previous year in my plot:
proc sgplot data=year_summary_market(where=(year between "&base_year" and "&prev_year"));
vbarparm category=year response=total_sold / group=market dataskin=gloss;
xaxis display=(nolabel);
run;
quit;
Thanks
Jim
Hi Marcia,
I have a bar graph as shown above but for about 25 bars on x-axis. I want to different color or fill for the last 5 bars. How can I do this?
Thank you,
Rao
Hi Rao,
If you want to have the last 5 bars a different color from the first 20 bars, you can define a variable to group the bars. The color of the bars is the same for all bars within a group. The new variable would be used as the GROUP= variable on your VBAR statement and the STYLEATTRS statement with the DATACOLORS= option can be used to specify the colors for each of these groups.
For example:
data sample;
do midpt=1 to 25;
if midpt>=21 then grp=2;
else grp=1;
output;
end;
run;
proc sgplot data=sample;
styleattrs datacolors=(blue green);
vbar midpt / group=grp nooutline;
run;
If this doesn't answer the question, send email to support@sas.com and we will be glad to help you out with the specifics for you graph.
Thanks for this helpful post, Marcia. I'm wondering, is there a way to underline text in the plot? For example, underlining the legend title.
Thanks,
Daniel
Marcia,
Can you change the font family to Arial Narrow?
Thanks,
Hi Brian.
You can specify family="Arial Narrow" withtin the attribute option for the text that you want to change. Such as:
xaxis valueattrs=(family="Arial Narrow");
Marcia