In a previous blog, I describe how there are a few new features related to report and page prompts in SAS Visual Analytics 8.1; namely the ability to configure cascading prompts in VA 8.1: Cascading Prompts as Report and Page Prompts.
In this blog, I will cover how to configure prompts, either report, page, or report canvas prompts, that use different data sources.
Different Data Sources with overlapping data values
First, you must have two different data sources added to your Visual Analytics report. These data sources must have values that overlap that you wish to prompt on. All of the values do not need to map, but they must have some values in common if you wish to use a shared prompt.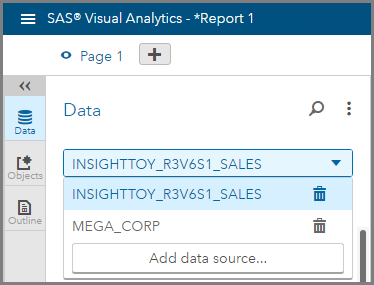
In this example, we will prompt for Product Line. Let’s examine the column values:
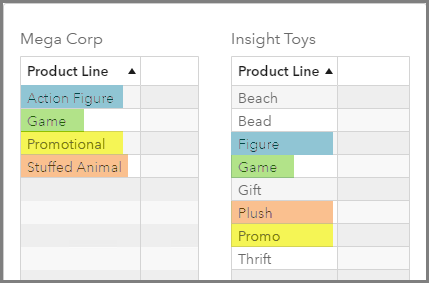
I’ve color coded the values that I would like to map together. I see that the only values that match “out-of-the-box” is Game.
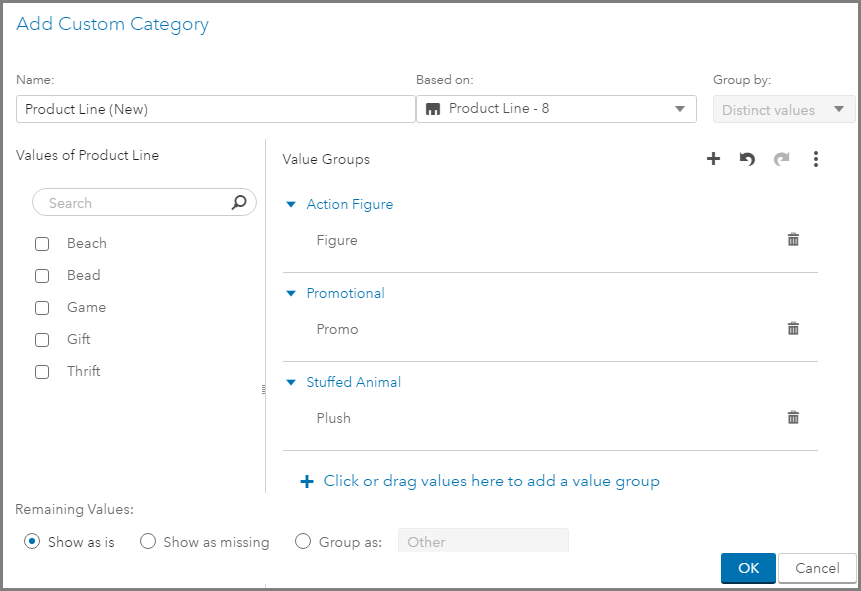
One work around to get all of the values to match will be to create a Custom Category and use that column for the mapping.
In a “real world” scenario, this may not be ideal. The cardinality of the two columns may be so large that you may have to go back to either the source data or ETL job to produce better matching values.
However, if you are using date columns as the mapping columns things are considerably easier as year, month, and quarter are standard values that match without extra steps.
Here is my new Custom Category that I will use for my mapping:
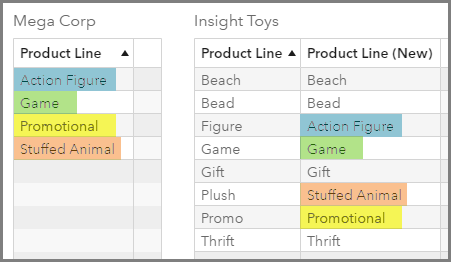
Here are my mappings now. I will be using Product Line (New) for the Insight Toys data source moving forward.
Add prompts
There are two different locations where you can add prompts, i.e. Control Objects, which means there are two different ways to configure prompts with different data sources:
1. Report and Page Prompts
2. Report Canvas Prompts
Report and Page Prompt configuration for different data sources
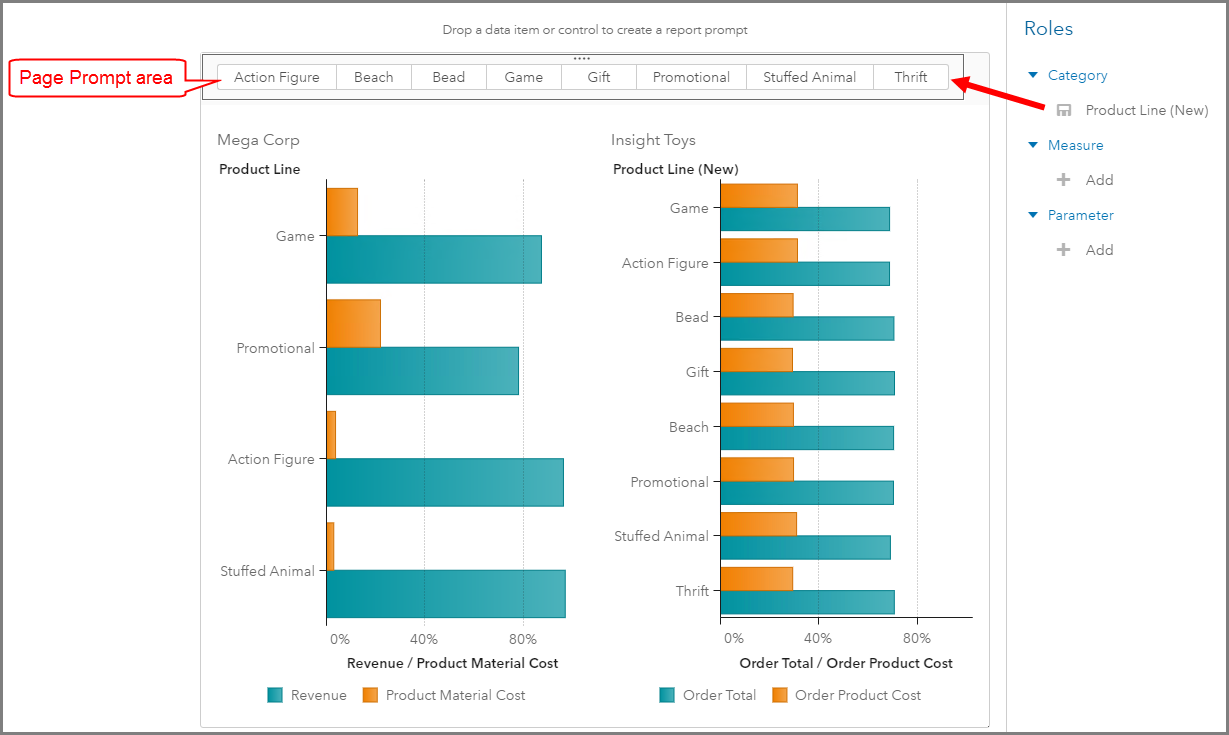
For this first example, I will configure a Button Bar object placed in the Page Prompt area to filter two different data sources. For the Button Bar’s Category Role, I will use the data source with the largest available selection, in this case, the Product Line (New) from Insight Toys.
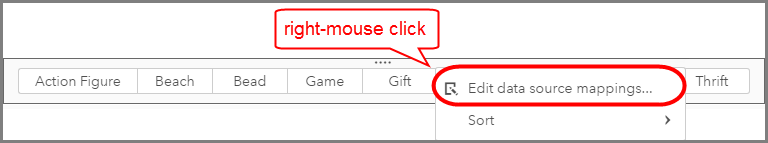
Now let’s configure this button bar to filter both data sources. You must activate the button bar by clicking on it, then right-mouse click and select Edit data source mappings…
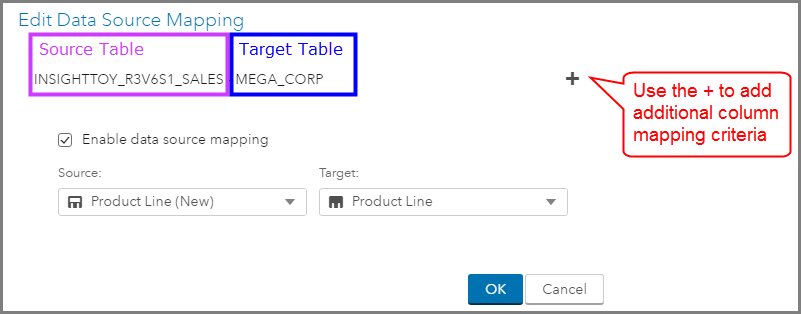
Then you simply have to pick your source table’s column to map to your target table’s column.
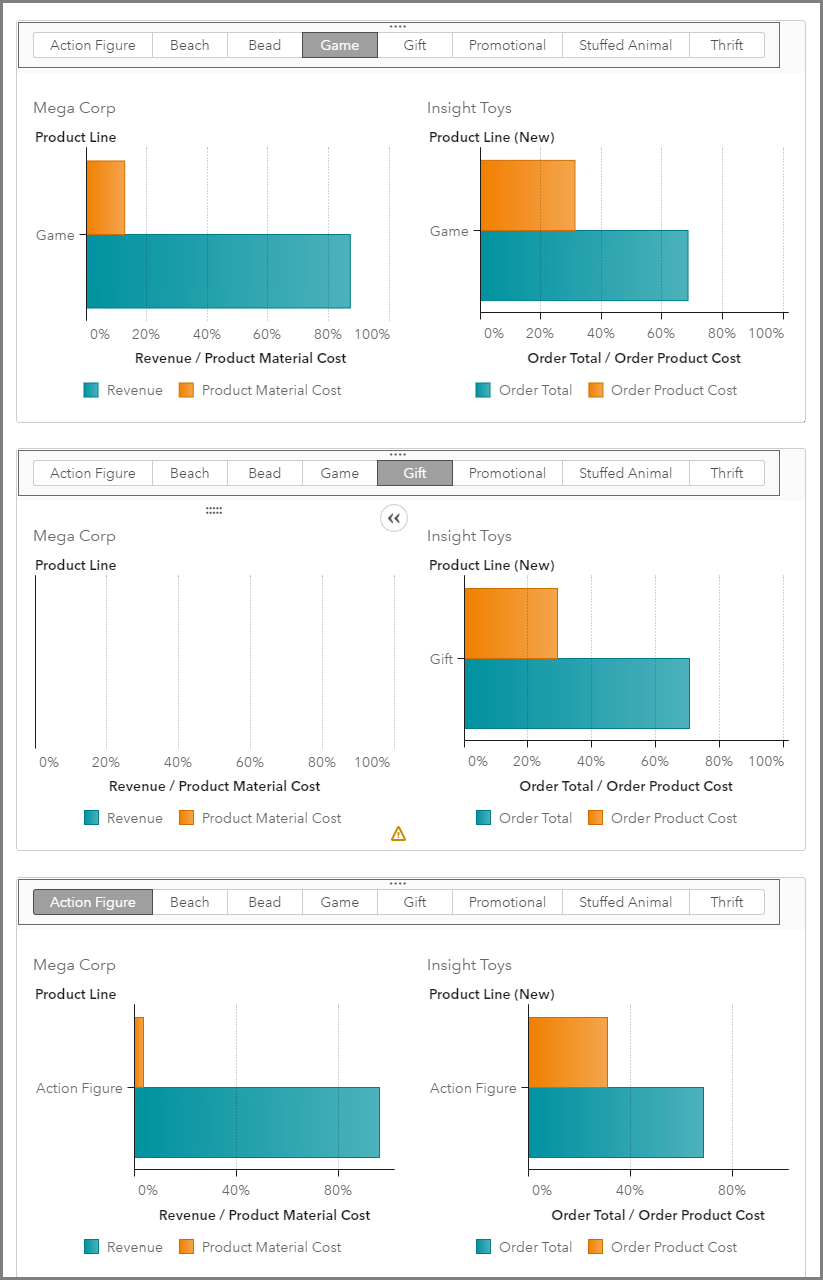
That’s it. The mapping is complete. Here is what the report would look like with different selections made for the button bar. Notice, that since I used the Insight Toys data source for the Role assignment, and it has more values than available in the Mega Corp data. If a selection is made where nothing matches in Mega Corp, as in the Gift example, then the Mega Corp bar chart is blank.
Report Canvas Prompt configuration for different data sources
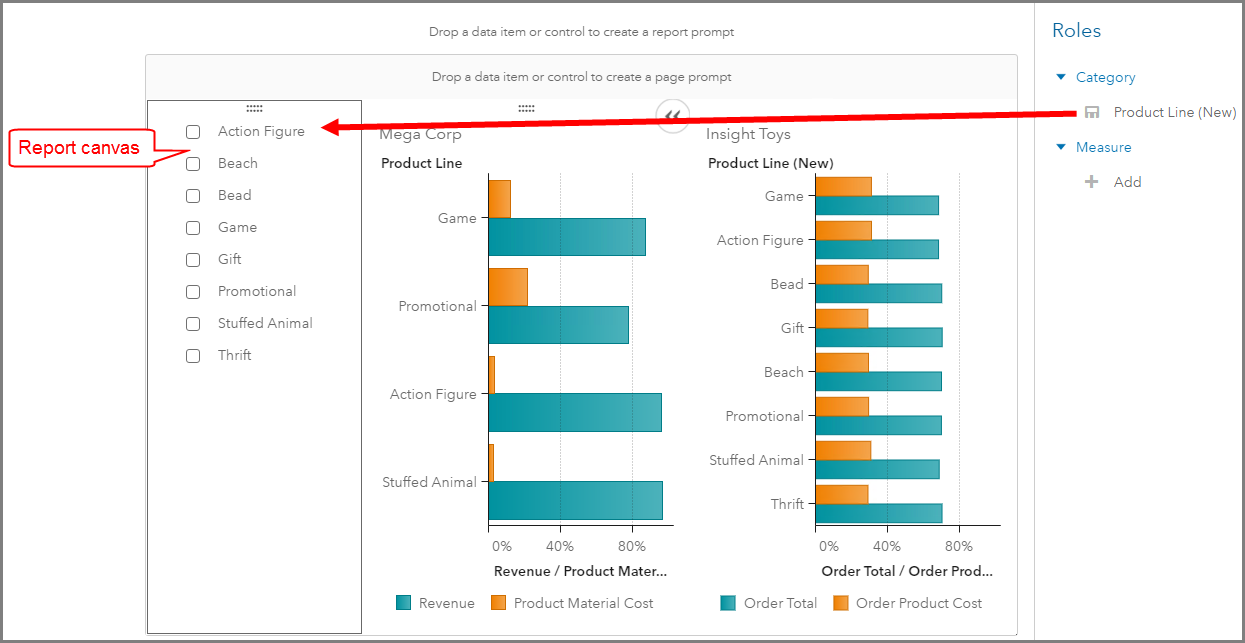
In this second example, I am going to use a List Control object within the report canvas to filter two different data sources. Again, I will use the Insight Toys’ Product Line (New) column as the List Role Category assignment since it has the most values.
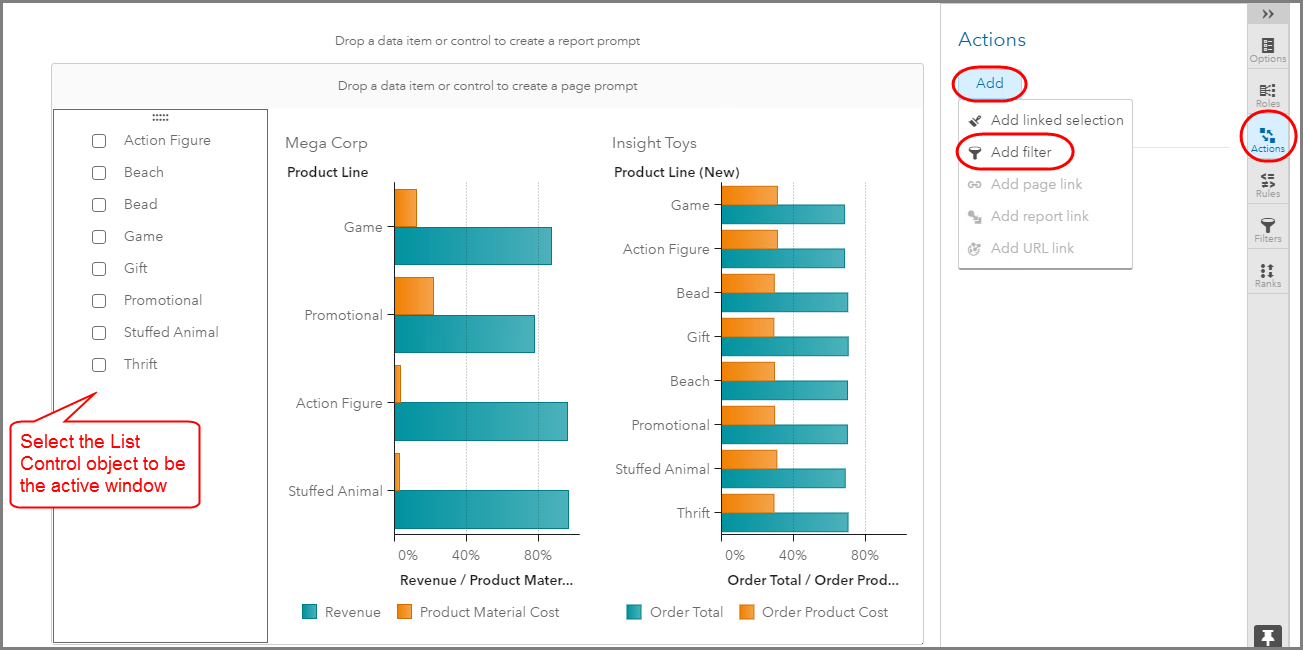
Now to configure the list to filter both bar charts. Click on the list control object to activate the window. Then select the Actions pane, and use the Add button to select Add filter.
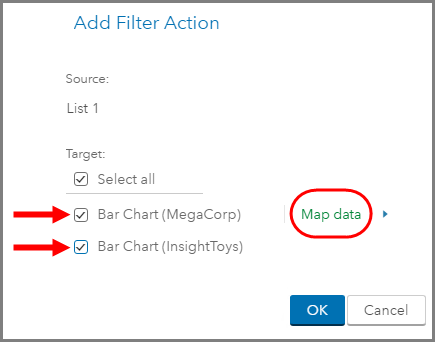
Then select both bar charts as the target of the filter Action.
Next, select the Map data option.
Select the source data’s column to map to the target data’s column. Use the + to add additional column mapping criteria.
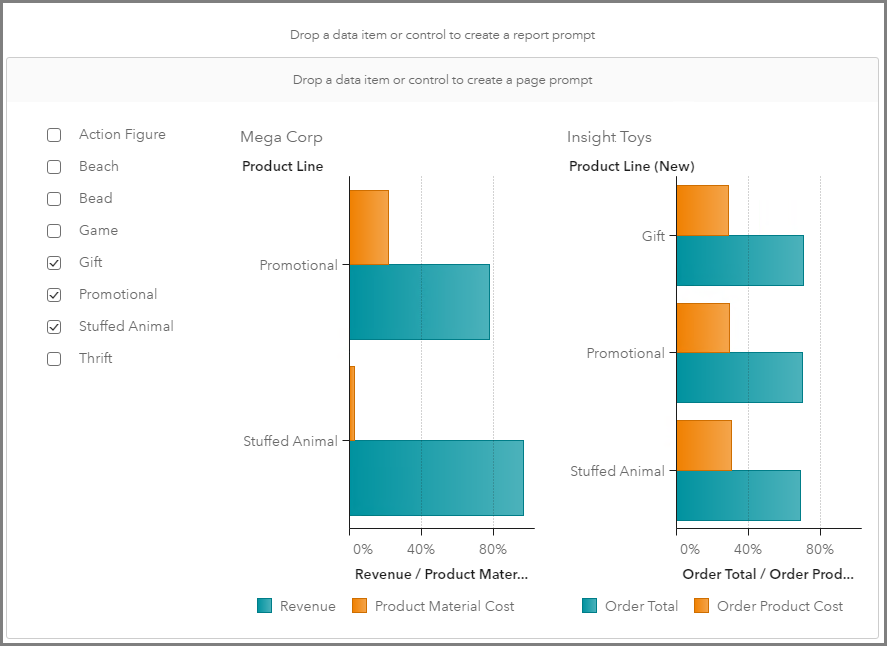
Here is how the report would look with a few of the values selected from the list table. You can see how both Mega Corp and Insight Toys display overlapping values for Product Line but for any unique Product Lines, such as Gift, its values are only displayed on the Insight Toys bar chart.
Now you know how to configure your control objects for multiple data sources. This works no matter how many data sources you add to your report, simply use the Map data option and select the mappings between the source data and target data.
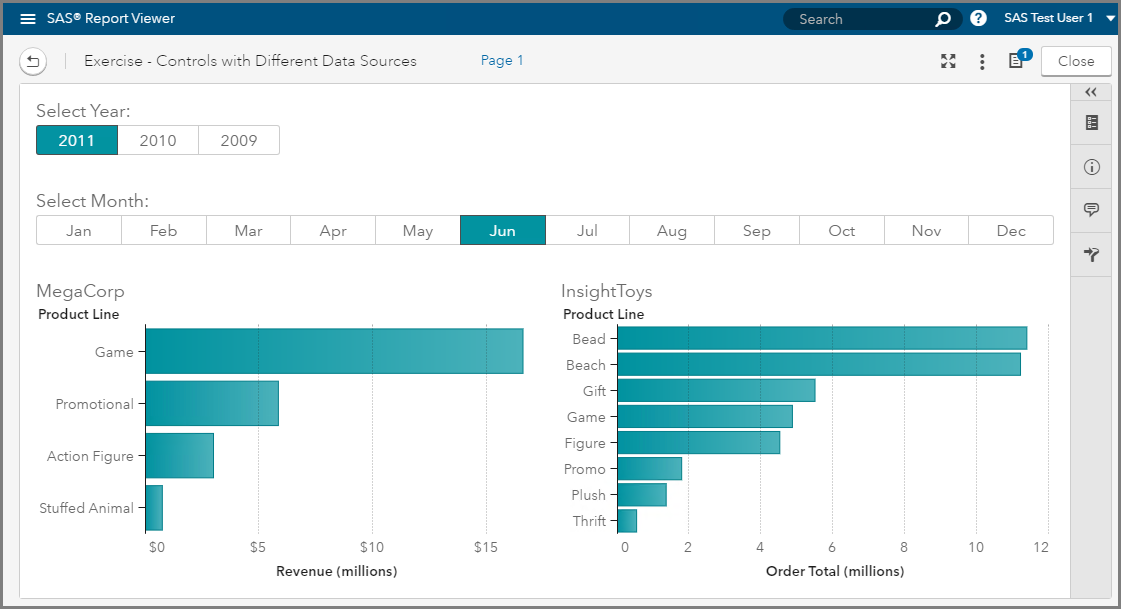
As I mentioned earlier, a frequently used application of mapping prompts for multiple data sources is for date columns. Here is a screenshot of one example using year and month. I also styled the button bar’s selected background and text color to coordinate with the graphs.
Demonstration
Watch this video tutorial for a demonstration of configuring prompts with different data sources.

4 Comments
Hello Teri,
I am a newbie on SAS Visual Analytics and I am searching the net regularly to find example reports with sample data and the step by step tutorials to gain some more experience on the capabilities of the SAS VA.
I have just found your blog post which the link is given below:
https://blogs.sas.com/content/sgf/2017/07/26/sas-visual-analytics-8-1-configuring-prompts-with-different-source-data/
I think I have the InsightToyDemo data but I could not find the Mega Corp. data.
I will be very happy if you can share the sample data with me and I will appreciate your help and support if you have any other samples.
Kind regards.
Hi Ali,
Thanks for your comment and welcome to becoming a fluent SAS Visual Analytics user.
I have a few locations where my material is posted:
• YouTube Tutorials: SAS Technical Insights & Expertise Series
• SAS Support Communities: My articles
• SAS User Blogs: My articles
Also, on support.sas.com under the SAS Visual Analytics documentation there are Tutorials that you can also watch for step-by-step examples.
Thank you,
Teri
Hi Teri, I am trying to link another report by adding a hyperlink to a text in a text box. Can I use parameters there so that the target report always opens with a certain filter?
Hi Tom,
This is possible given that the source report has the correct parameter values set. Then, for the target report, you can pass the parameters as values to filter the entire report of you can select "Set prompt bar values of target report" to use those parameter values as control object selections only.
I'll reach out via email incase you have additional questions.
Thank you,
Teri