In my last blog, we examined the data pane in SAS Visual Analytics 8.1. That blog discussed how to have the data pane display the data items of your active data source, and how to perform tasks such as viewing measure details, changing data item properties, and creating geographic data items, hierarchies, and custom categories. In this blog, we’ll look at creating new calculated data items and calculated aggregations.
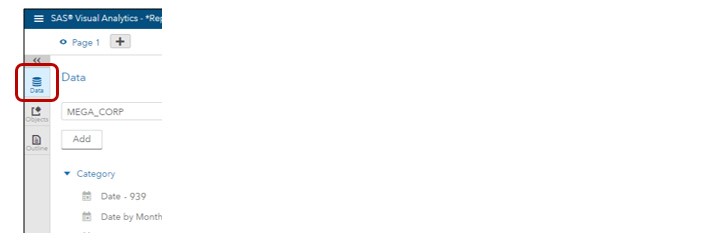
If you recall, you display the Data pane in the Visual Analytics interface by clicking the Data icon on the left menu.
A calculated data item is a new data item created from existing data by using an expression.
- Calculations are performed on un-aggregated data—the expression is evaluated on each row before aggregations are calculated.
- Calculated data items can accept parameters.
- A hierarchy can contain calculated category data items.
- Calculated data items can be changed to geography data items and used in geo maps.
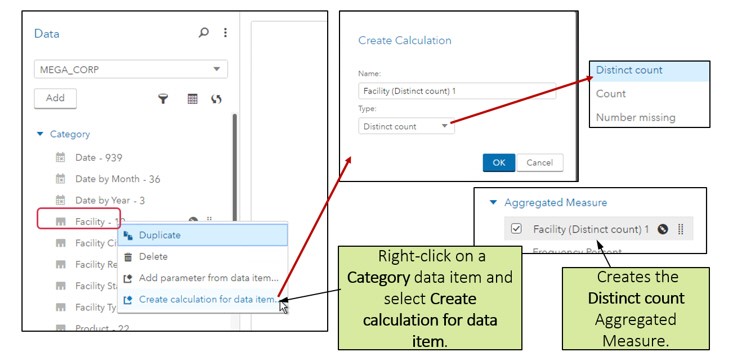
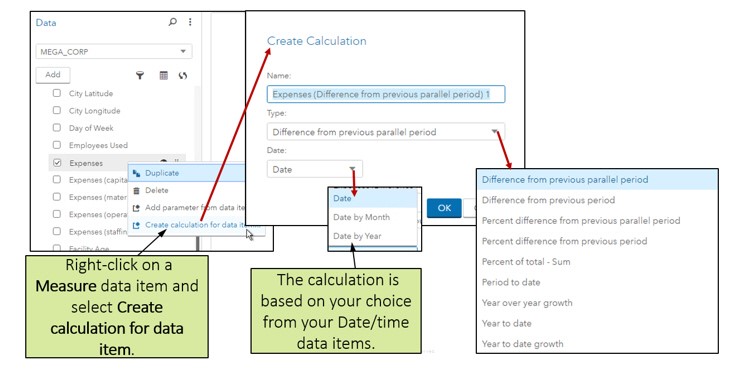
You can create a derived calculation from a category or measure data item by right-clicking on the data item and selecting Create calculation from data item.
For a category data item, you can create a distinct count, count, or number missing. Creating a derived calculation from a category data item:
For a measure data item, you can create a percent of total, or a periodic calculation based on one of your date data items. Creating a derived calculation from a measure data item:
Notice that in both cases, the new data item is an aggregation, so the new item will appear under the Aggregated Measure category in the data pane.
Note: In order to use the periodic calculation types, your selected data item must include the year.
You can also edit these new data items by right-clicking on the data item and selecting Edit. Editing a derived calculation:
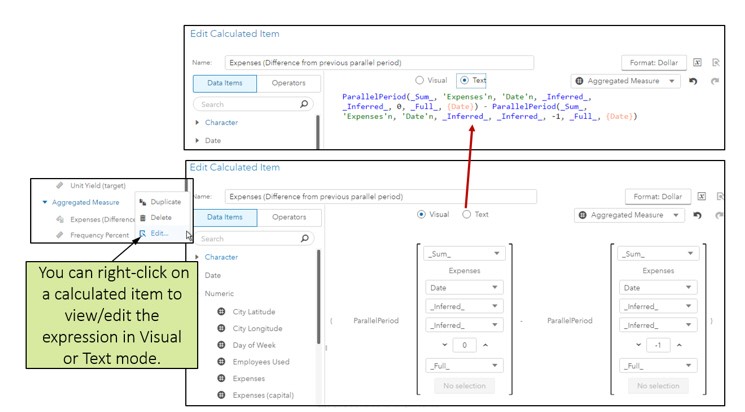
There is now a single interface for creating calculated data items of type Numeric, Character, Date or Datetime or Aggregated measures.
- This interface provides both Visual mode and Text mode for viewing and editing the expression.
- You can drag and drop data items or parameters and operators onto the expression in either mode.
- In text mode, you can also type in your expression.
Creating a calculated data item or aggregated measure:
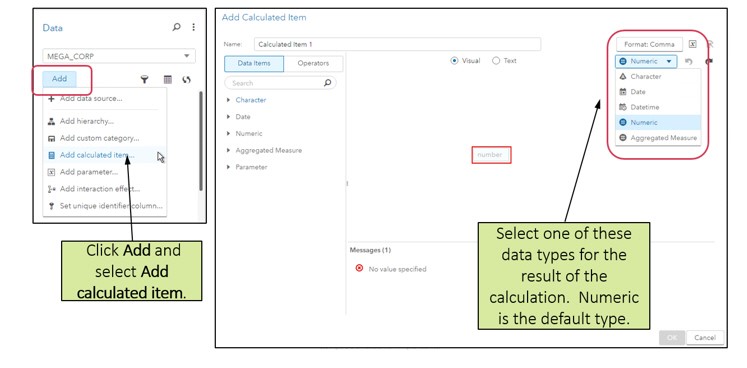
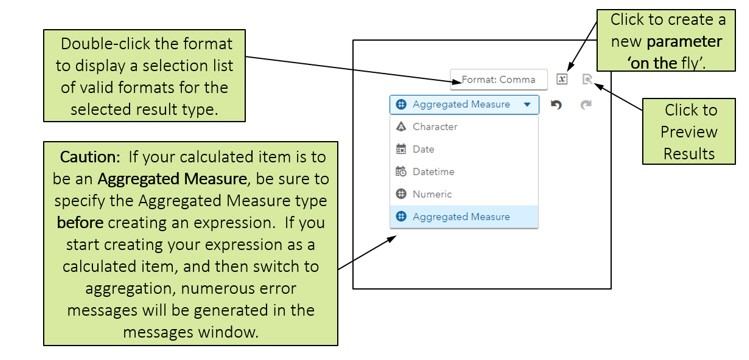
Specifying the calculation result type and format:
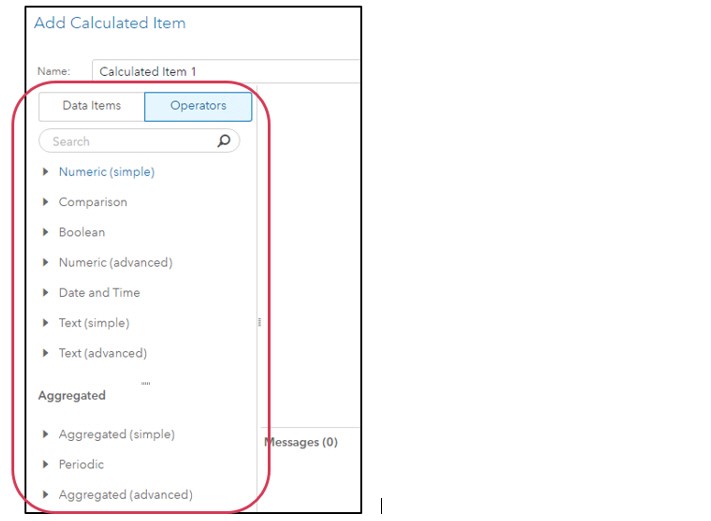
Some notes for using operators in calculations and aggregations:
- Operators are provided for both calculations and aggregations.
- You can expand and collapse each category of operators.
- If you add an Aggregated operator to an expression, the result type will be changed to Aggregated Measure.
- You cannot have nested aggregations in an expression.You also have access to periodic operators and simple and advanced aggregated operators for calculation aggregations.
In the same interface, you have access to simple and advanced numeric operators, simple and advanced text operators, along with boolean, date and time, and comparison operators for your calculations.
You also have access to periodic operators and simple and advanced aggregated operators for calculation aggregations.
The most important point to remember in using this interface is to think ahead as to whether you are creating a calculation (operating on each row) or an aggregation (operating across rows) and specify the data type and format before you begin to drag and drop data items and operators. The default data type is Numeric, but if you add an aggregation operator, the type will automatically switch to Aggregated Measure.
Remember that you also create calculated items of character, date, and datetime data types–and you can choose from a list of date and datetime formats for those data types.