 My high school basketball coach started preparing us for the tournaments in the season’s first practice. He talked about the “long haul” of tournament basketball, and geared our strategies toward a successful run at the end of the season.
I thought about the “long haul” when considering my brackets for this year’s NCAA Tournament, and came to this conclusion; instead of seeking to predict who might win a particular game, I wanted to use analytics to identify which teams were most likely to win multiple games. The question that I sought to answer was simply, “could I look at regular season data, and recognize the characteristics inherent in teams that win multiple games in the NCAA Tournament?”
I prepared and extracted features from data representing the last 5 regular seasons. I took tournament data from the same period and counted numbers of wins per team (per season). This number would be my target value (0, 1, 2, 3, 4, 5, or 6 wins). Only teams that participated in the tournaments made the analysis.
I used SAS Enterprise Miner’s High Performance Random Forest Node to build 10,000 trees (in less than 14 seconds), and I determined my “top 10 stats” by simply observing which factors were split on the most.
Here are the results (remember that statistics represented are from the regular season and not the tournament), my “top 10 statistics to consider.”
1 --- Winning Percentage.
Winners win, right? It is evident this is true the further a team moves into the tournament.
- Teams that win a single game have an average winning percentage of .729
- Teams that win 6 games have an average winning percentage of .858
- No team that has won a Final Four game over the last 5 years has a winning percentage less than .706
- Teams that won 6 games have a minimum winning percentage of .765.
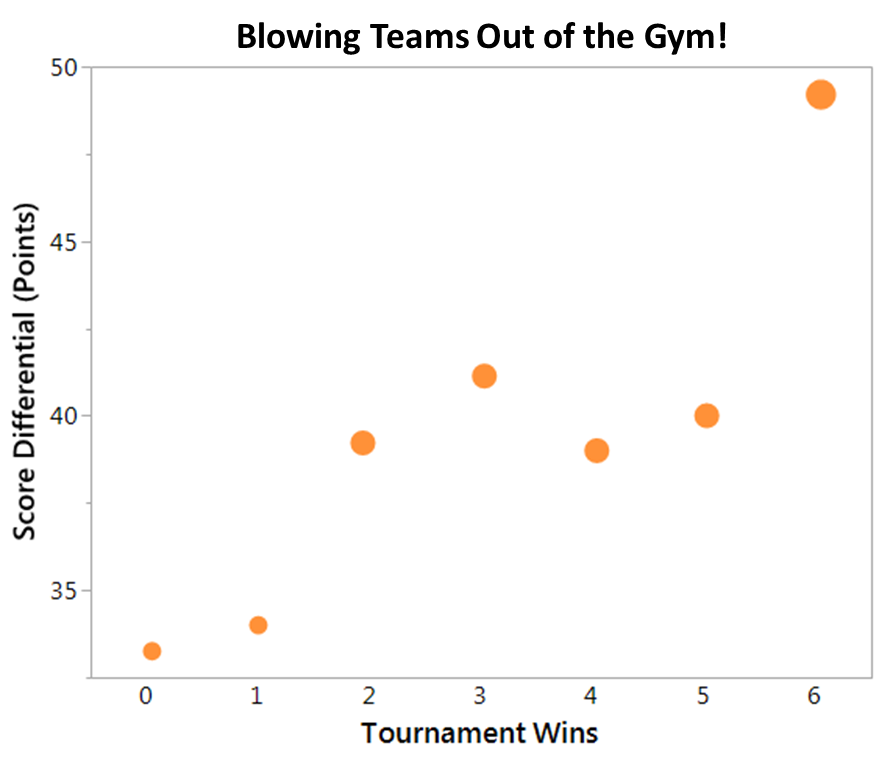
2 --- Winning games by wide margins.
Teams that advance in the tournament have beaten teams by wide margins during the regular season – this means that in some game over the course of the year, a team let go and won big! From a former player’s perspective, it doesn’t matter “who” you beat by a wide margin, but rather do you have the drive to crush the opponent?
- Teams that won 6 games have beaten some team by 49 points differentiating themselves from even the 5 win teams by 9 points!
3 --- Ratio of assists to turnovers (ATO)
Teams that take care of and distribute the ball tend to be making assists instead of turnovers. From my perspective, the ATO indicates whether or not a team dictates the action.
- Over the last 5 years, no team that won 6 games had an ATO less than 1.19!
- Teams that have won at least 5 had an average ATO of 1.04.
- Teams that won less than 5 had average ATOs of less than 1.
4 --- Winning percentage on the road
We’re already noted that overall winning percentage is important, but it’s also important to win on the road since the tournament games are rarely played on a team’s home floor!
- Teams that don’t win any tournament games win 52% of their road games
- Teams that win 1-2 games win 57.8%
- Teams that win 3-5 win 63%
- Team that win 6 win 78% of their road games, and average only 2.4 (road) losses per year
- No team that has won at least 5 games has lost more than 5 on the road (in the last 5 years)!
5 --- Ratio of a team’s field goal percentage to the opposition’s field goal percentage
Winning games on the big stage requires both scoring and defense! A ratio above 1 indicates that you score the ball better than you allow your opposition to score.
- Teams that win 2 or fewer games have a ratio of 1.12
- Teams that win 3-5 games have a ratio of 1.18
- Teams that win 6 games have a ratio of 1.23 – no team that has won 6 games had a ratio of less than 1.19!
6 --- Ratio of turnovers to the turnovers created (TOR)
I recall coaches telling me that a turnover committed by our team was essentially a 4-point play: 2 that we didn’t get, and 2 they did.
- Teams that win the most tournament games have an average TOR of 0.89. This means they turn the ball over at a minimal rate when compared to the turnovers they create.
- Over the past 5 years, teams that won 6 games have an average TOR .11 better than the rest of the pack which can be interpreted this way: they force the opposition into turnovers 10 times as often as they commit turnovers themselves.
7 --- Winning close games
Close games build character, and provide preparation for the tournament.
- Teams that win 6 games play more close games than any other group. The average minimum differential for this group is 1.6 points
- Teams winning less games average a differential of 1.8 points.
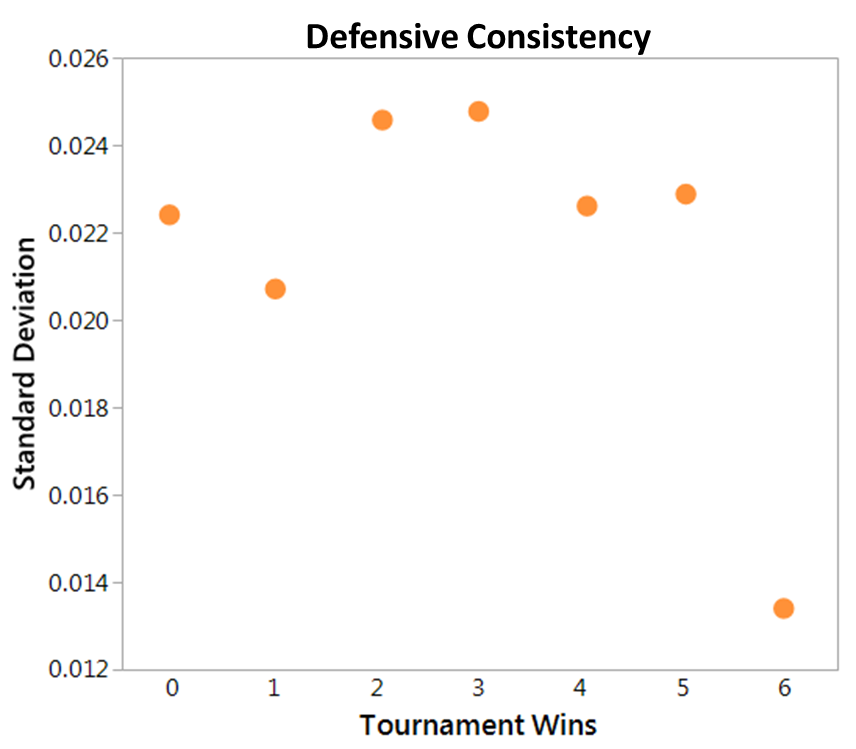
8 --- Defending the 3
Teams that win more games in the tournament defend the 3 point shot only slightly better than the other teams, but they are twice as consistent in doing it! So, regardless of who’s coming to play, look for some sticky D beyond the arc!
- On average, teams allow a 3-point field goal percentage .328
- Teams winning the most tournament games defend only slightly better at .324; however the standard deviation is the more interesting statistic indicating the consistency of doing so (defending the 3 point shot) is almost twice as good as the other teams!
9 --- Free Throw Average
Teams that win are good at the stripe! Free throws close games. Make them and get away with win!
- Teams that win the most games shoot for an average of .730 while the rest of the pack sits at .700
10 --- Blocked Shots Per Game
Teams that win the most games block shots. They play defense, period.
- Teams that win the most tournament games average over 5 blocks per game.
- Teams winning 6 games have blocked at least 3.4 shots per game (over the last 5 years)
Next steps? Take what’s been learned and apply it to this year’s tournament teams, and then as Larry Bird used to do, ask the question, “who’s playing for second?”
In addition to SAS Enterprise Miner, I used SAS Enterprise Guide to prepare the data for analysis and, I used JMP’s Graph Builder to create the graphics. The data was provided by Kaggle.

2 Comments
Really cool
Great way of analyzing team performance.