Several months ago, I posted a blog about calculating moving averages for a measure in the Visual Analytics Designer. Soon after that, I was asked about calculating not only the average, but also the standard deviation over a period of months, when the data might consist of one or more repeated values of a measure for each month of a series of N months. For the example of N=20 months, we might want to view the average and standard deviation over the last n months, where n is any number between 3 and 20.
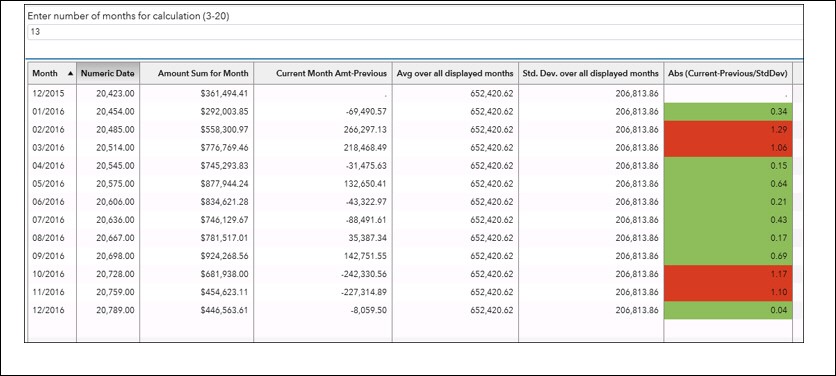
The example report shown below allows the user to type in a number, n, between 3 and 20, to display a report consisting of the amount values for past n months, the amount values for Current Month Amt-Previous, the Avg over the last n months, the Standard Deviation over the last n months, and the absolute value of the (Current Month Amt – Previous Month Amt), divided by the Standard Deviation over the last n months. A Display rule is applied to the final Abs column, showing Green for a value less than 1 and red for a value greater than or equal to 1.
The data used in this example had multiple Amount values for each month, so we first used the Visual Data Builder to create a SUM aggregation for Amount for each unique Date value. This step gives more flexibility in using the amount value for aggregations in the designer.
When the modified data source is initially added to the report, it contains only the Category data item Month, with a format of MMYYYY, and the measure Amount Sum for Month.
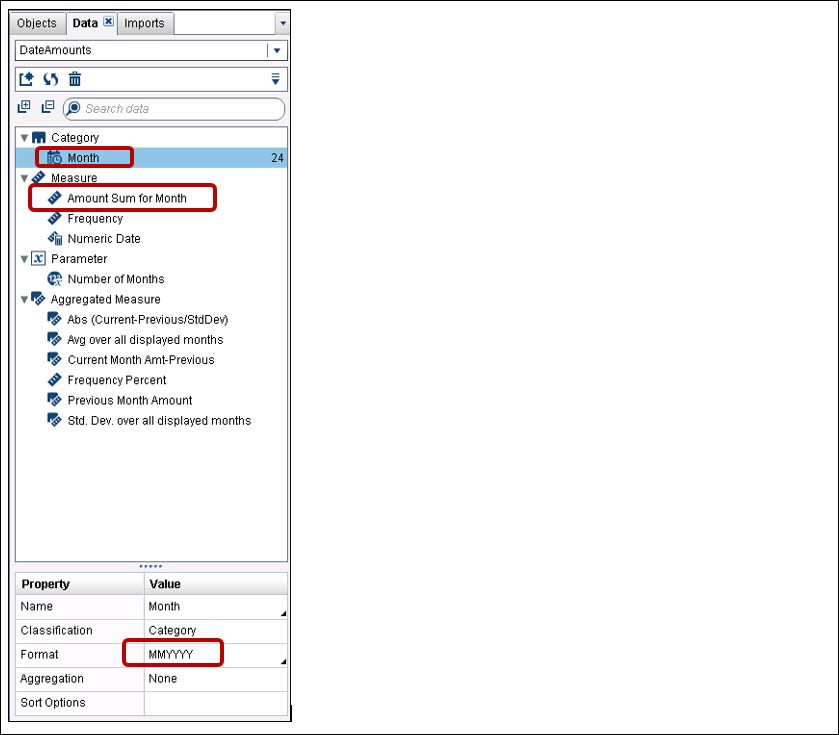
The data will be displayed in a list table. The first columns added to the table will be Month, displayed with a MMYYYY format, and Amount Sum for Month.
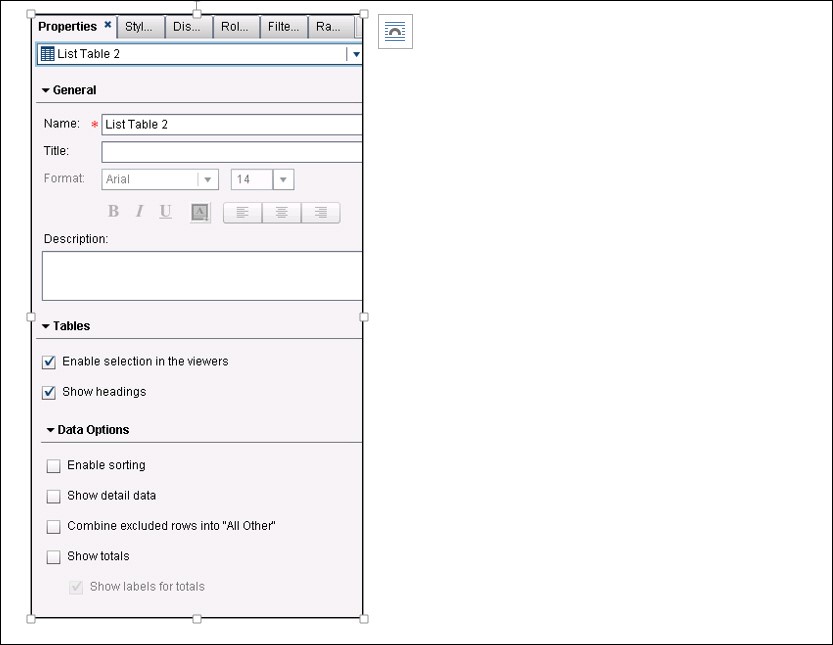
Specify the properties for the list table as below:
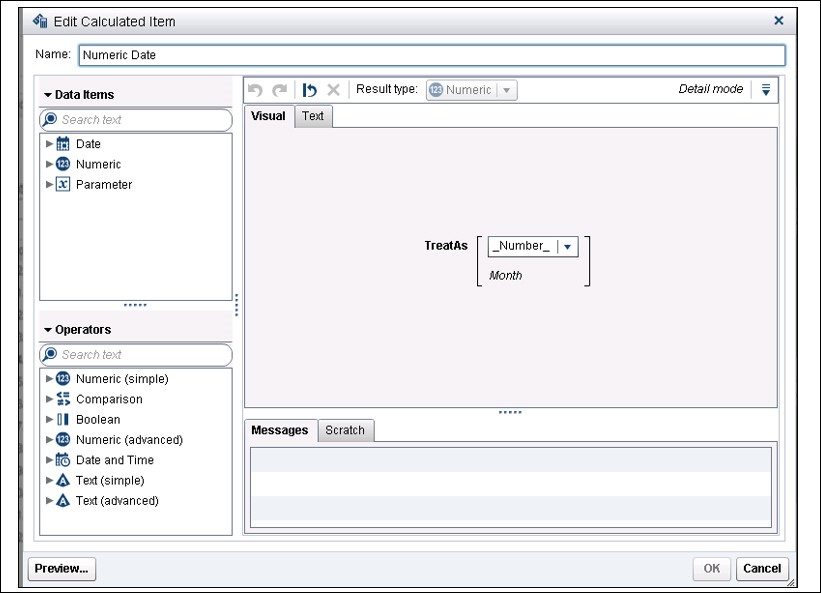
Since we want to display the last n months, we create a new calculated data item, Numeric Date, calculated as below, using the TREATAS operator on the Month data item:
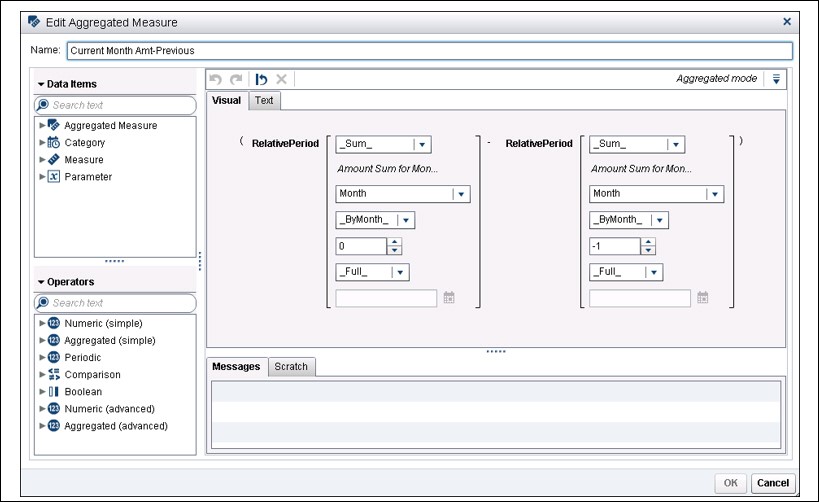
Then we create the Current Month Amt-Previous aggregated measure using the RelativePeriod date operator:
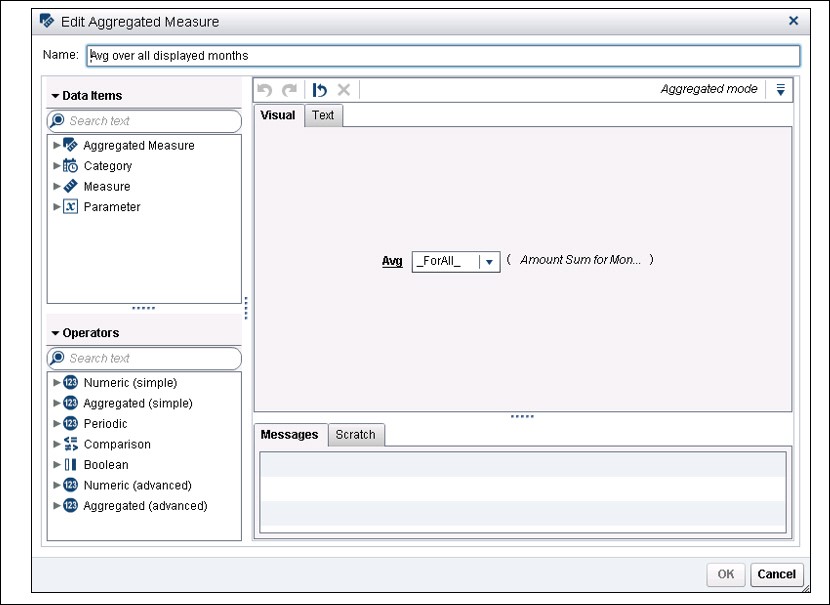
Next, create the Avg over all displayed months aggregated measure as below:
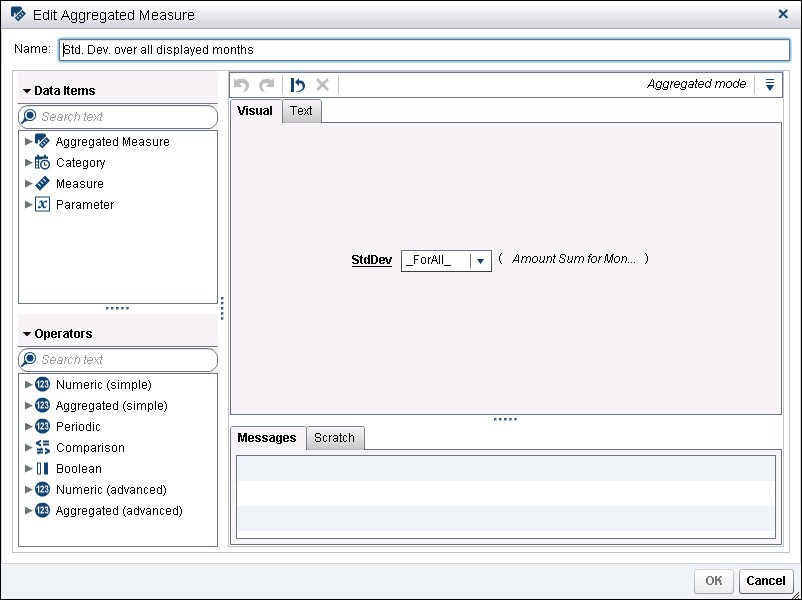
Then, create the Std.Dev. over all displayed months aggregated measure as shown below:
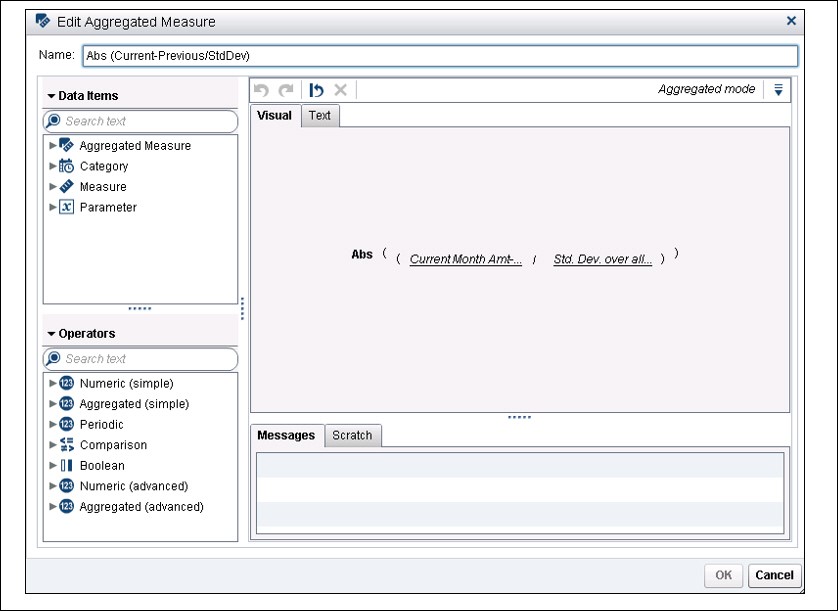
Create the Abs (Current-Previous/StdDev) as shown below:
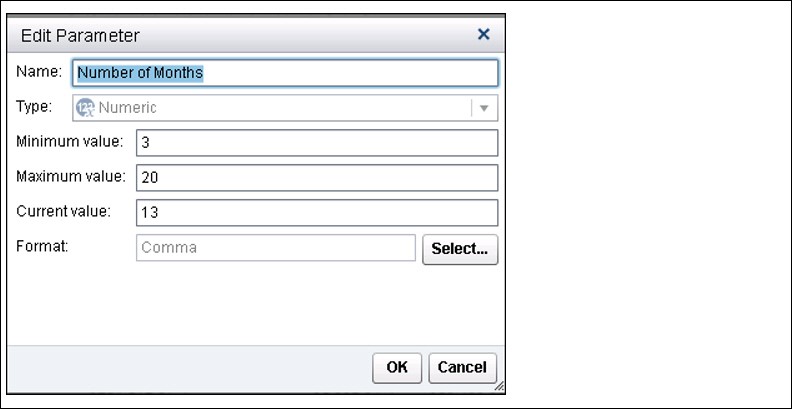
Create a numeric parameter, Number of Months, as shown, with minimum value of 3 (smallest value that a standard deviation will make sense) and maximum value of 20 (the number of months in our data). You can let the default (Current value) value be any value that you choose:
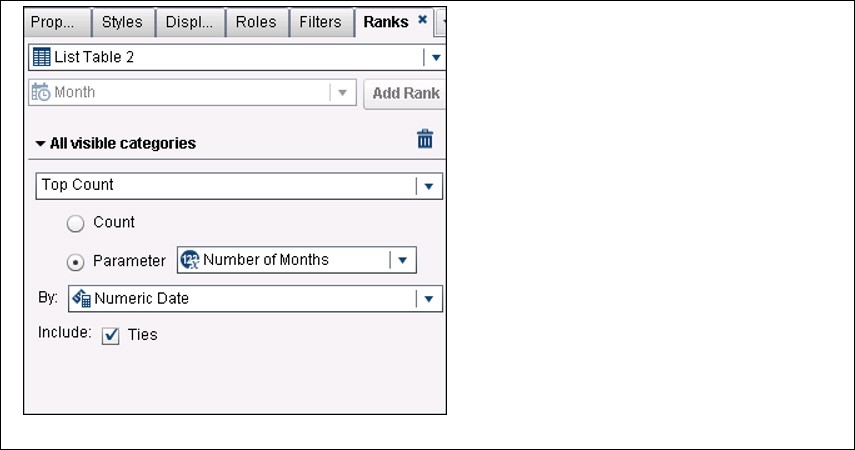
For the List Table, create a Rank, as shown below. Note that we are creating the rank on the Numeric Date (not the Month data item), and rather than a specific value for count, we are going to use the value of the parameter, Number of Months.
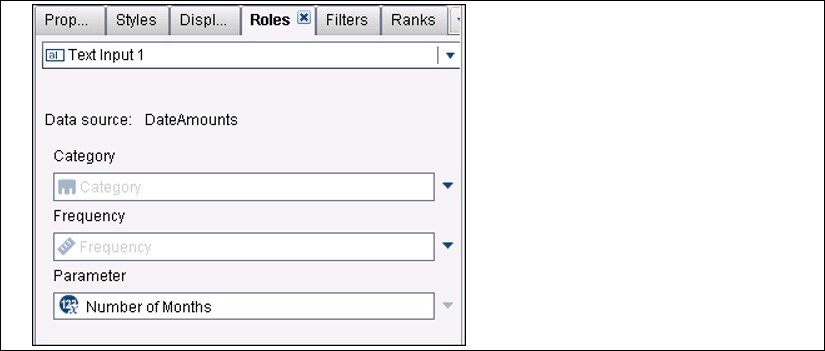
Create a text input object that enables the user to type in a ‘number of months’ between 3 and 20.
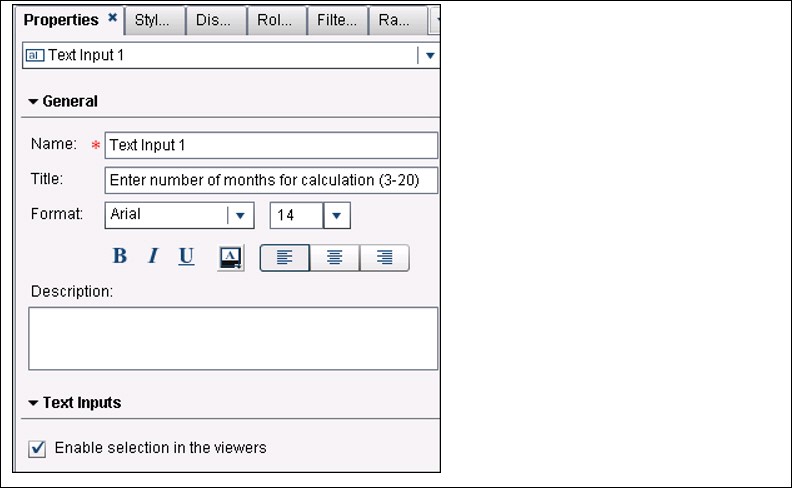
Associate the Parameter with the Text input object:
If you wish, you can add display rules to sound an alarm whenever there is an alarming month-to-month difference in comparison to the standard deviation for the n months.

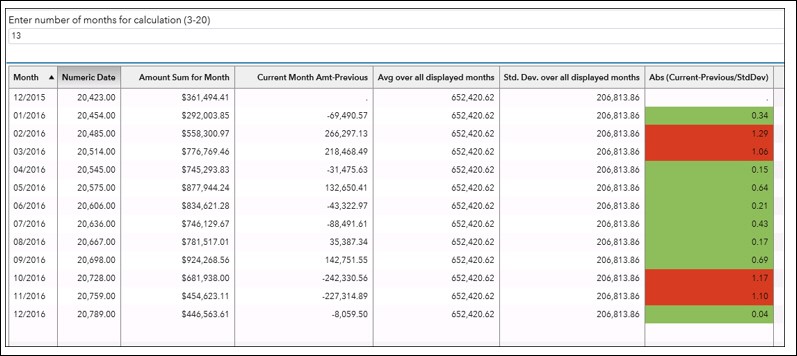
So the final result of all of the above is this report, which points out month-to-month differences, which might deserve further concern or investigation. Note that the Numeric Date value is included below just to enable you to see what those values look like—you likely would not want to include that calculated data item in your report.