In this post I wanted to shed some light on a visualization you may not be using enough: the Word Cloud. Word association exercises can often be a fun way to pass the time with friends, or it can trigger immediate action – just think of your email inbox and seeing an email from a particular person: your boss, wife, husband or child. The same can be true for information for your organization. A single word can quickly, efficiently and effectively communicate the performance of a company’s metric, hence the value of using a word cloud visualization in your report.
Let’s look at some examples. Here I am using the Insight Toy data and looking at the performance of Products based on customer orders.
As the word cloud in SAS Visual Analytics 7.3 Designer has a maximum row return of 100, I have used the Rank feature to look at the top 25 Products and the bottom 25 Products. I also created a filtered interaction between the word clouds and their respective list tables below to show a bit more detail around the next level in the hierarchy after Product Make.
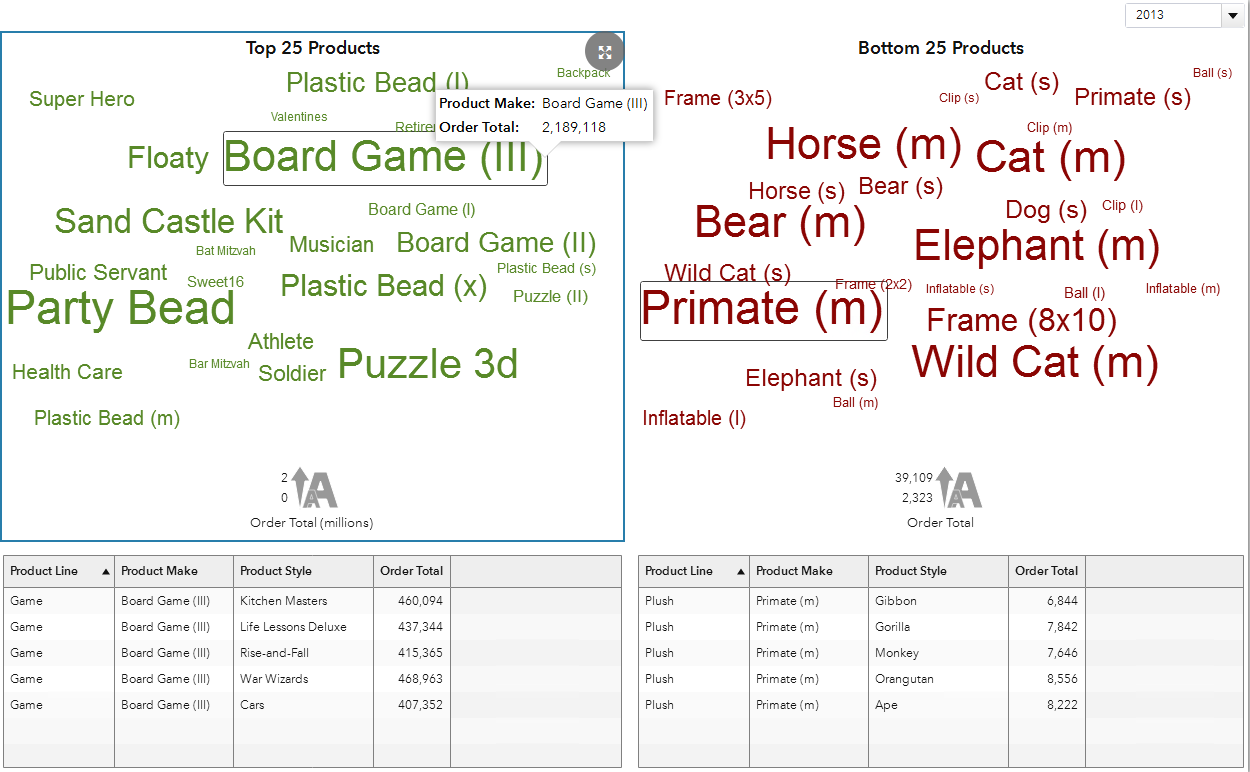
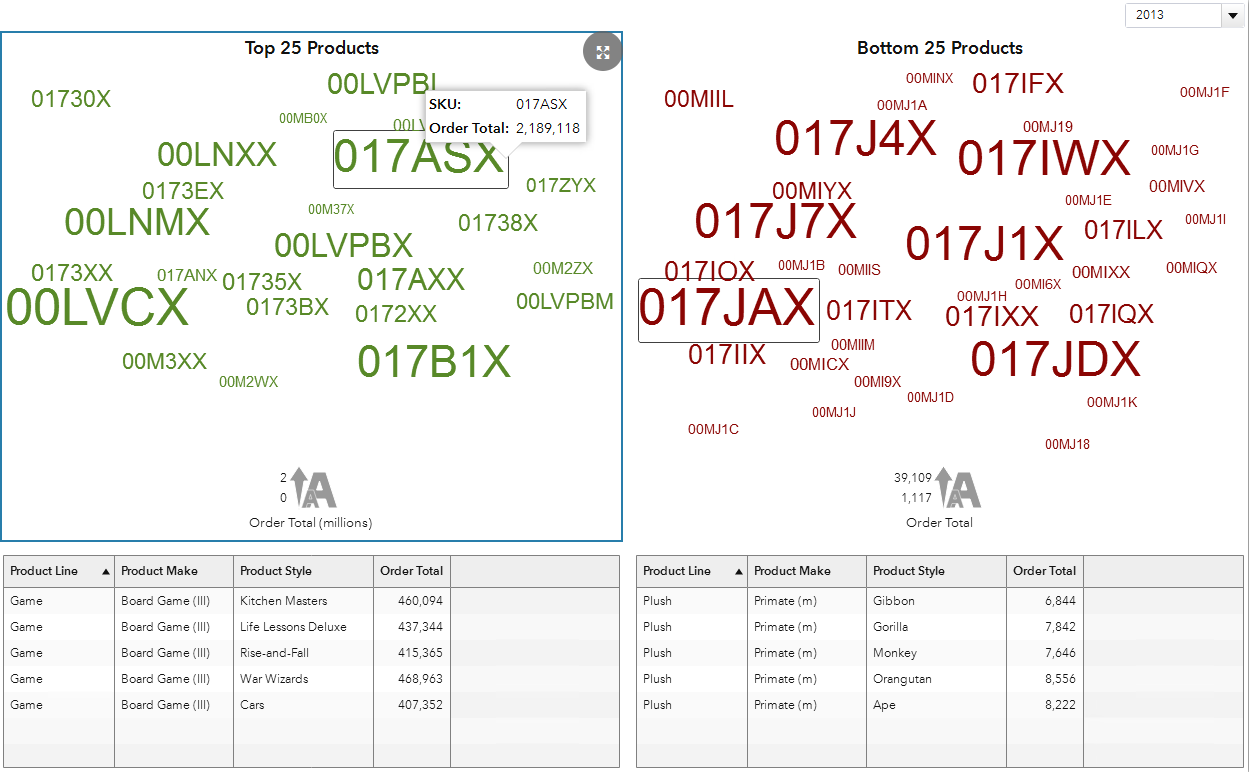
Notice how impactful these Product names are compared to when using their corresponding SKUs. Be sure to pick a meaningful category to represent your data in the word cloud.
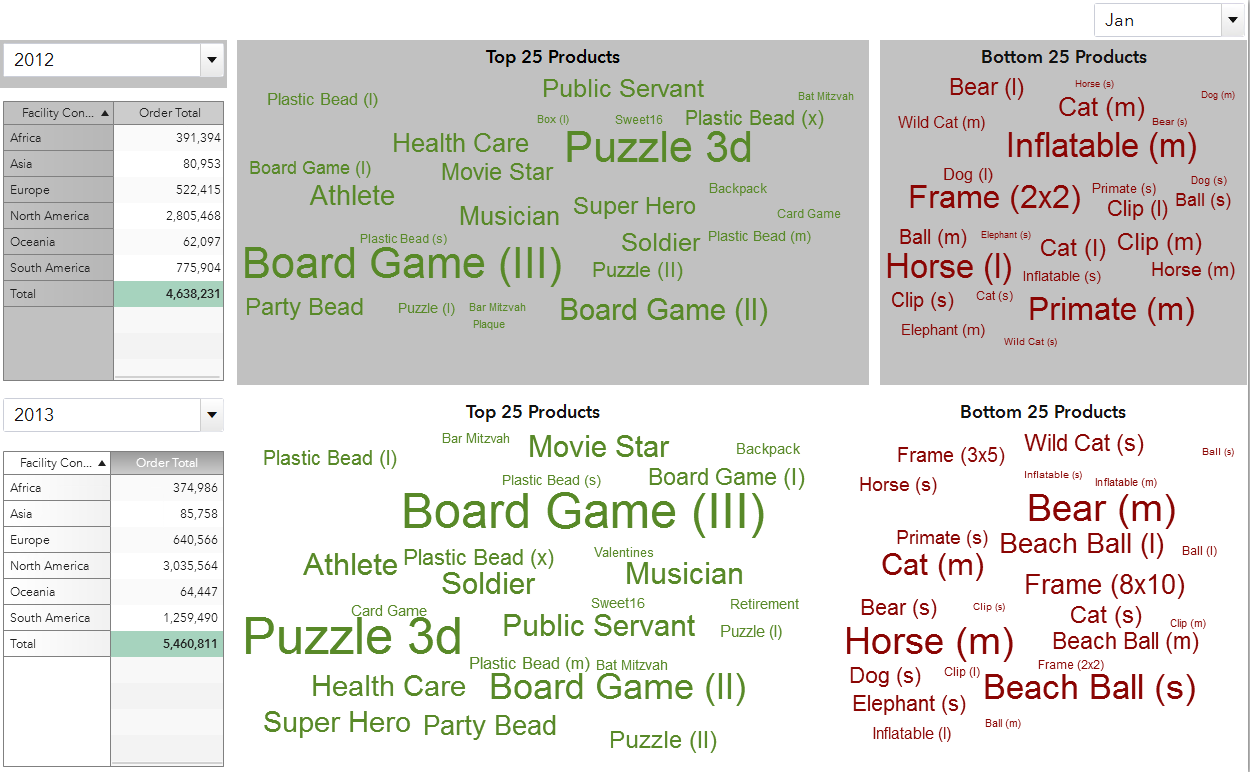
This type of visualization could lead to a great comparison report, comparing what the top and bottom Products were for the same month in the previous year.
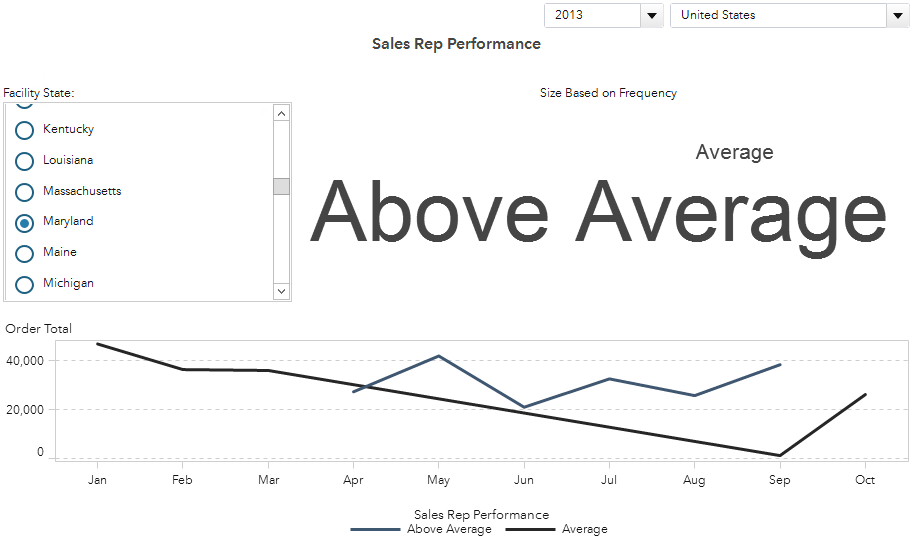
What if your data doesn’t have the appropriate column to display on a word cloud? No problem. In this next example, I took the value of Sales Rep Rating and created a new Calculated Data Item to represent values less than or equal to 25% to be Poor, inclusively between 26% and 50% to be Average and everything else to be Above Average.
Using a word cloud for this new category data item allows you to quickly move through the different states and compare the Sales Rep Performance frequency. You could also use this new category to compare each performance group’s Order Totals.
Here is California’s Sales Rep Performance:

And here is Maryland’s Sales Rep Performance:
These are two ideas for you to think about how you might include the word cloud visualization into your reports to help quickly and effectively represent the status of a company’s metric beyond the standard text analytics usage.

7 Comments
How does one enable the text analytics within word clouds in Report Designer? Im using 7.3 and while I can create a text analysis word cloud in Explorer, I have no option to do so in Report Designer.
Unfortunately you cannot enable text analytics for the Word Cloud object within Report Designer. This feature is only available in Explorer.
That's too bad! I hope it's added as an enhancement soon. Not a lot of point in an exploration if it can't be further developed into a report!
It is a great feature and it is available to reports in SAS 8.1 on SAS Viya.
So we just did a big implementation of SAS VA. Now it's already outdated and we need to buy Viya? I'm sorry but implementing features important enough to blog about that you make only available in one of the two sides of a product like VA, and then saying we need to go to another product feels like bait and switch. Moreover, not everyone works with data than can be pushed to a cloud.
This blog covers the functionality available in VA 7.3 Designer – Word Cloud. So if you have VA 7.3 then you have the Word Cloud object to use in your VA reports – and you can replicate everything I showed here in the blog and my screenshots. None of my screenshots in this blog use the text analytics functionality.
My understanding was that your question was about the text analytics, also known as sentiment analysis which is (https://en.wikipedia.org/wiki/Sentiment_analysis) the processing of text to identify if the text has a positive, neutral, or negative meaning. Frequently used words that do not add to the evaluation of sentiment are included in a Stop List and are ignored at processing (https://en.wikipedia.org/wiki/Stop_words). This functionality is immensely computationally intensive and which is why it is only available from the VA 7.3 Explorer. Those with access to Explorer are considered power users and have access to the other more computationally intensive analytic visualizations not available in Designer. To include it in VA 7.3 Designer for reports where it could potentially be hit by hundreds or thousands of users – it would not be performant.
The Word Cloud with text analytics is available with Viya VA 8.1 as Viya uses our next generation analytic engine with improvements to algorithms and multi-threading which allows us to make this visualization available for reports. Also, Viya, like our previous software versions, can be deploy on premise hardware or the cloud – so if your data isn’t cloud ready you can install on local hardware.
Ed, why do you need to perform text analytics in the Report Designer? What additional functionality are you looking for, that is not supported by the Explorer?